


Use of Sentinel-1 to monitor the evolution of rice production in the Vietnam Mekong Delta over the last decade
Thao Nguyen-Thi
1*,Alexandre Bouvet

1, 
Lionel Jarlan
1, Thuy Le Toan
2,Stéphane Mermoz
2, Juan Doblas Prieto
2- Univ Toulouse, CNES, CNRS, INRAE, IRD, CESBIO, Toulouse, France
- GlobEO – Global Earth Observation, Toulouse, France
* Author to whom correspondence should be addressed.


Abstract
The Vietnam Mekong Delta (the VMD) accounts for about fifty percent of Vietnam's rice output and faces significant threats from climate-induced saltwater intrusion, land subsidence, and modified hydrological patterns. This research utilizes a nine-year Sentinel-1 C-band SAR time series (2016–2024) at a 10 m resolution to delineate rice cropping intensity and ascertain pixel-level sowing dates throughout the VMD. We present a two-step, threshold-based methodology that initially utilizes spatial masking to identify prospective rice pixels. We then apply an Adaptive Savitzky–Golay filter on the VH/VV backscatter ratio to predict seasonal intervals autonomously. The highest increase in VH backscatter (VHmax_increase) is calculated for each window and classified using annual, incidence “angle-dependent” polynomial criteria, thus accommodating sensor geometry variability throughout the study site. Validation against 600 reference samples results in overall accuracies ranging from 90.5% to 96%, with peak performance observed during stable ENSO years. Model-derived total rice acreage estimates correspond within 5–16% of General Statistics Office statistics. Spatial analysis indicates a transition from primarily triple-cropping in the upper delta to diminished cropping intensity and an expansion of non-rice land use in coastal provinces, influenced by consecutive El Niño and La Niña phenomena. Sowing date distributions exhibit adaptive calendar adjustments of up to 20 days due to high salinity and flooding conditions. These findings highlight how using an angle-adaptive threshold is useful for rice monitoring and show that the region is adjusting its methods to cope with changing climate challenges.Keywords
rice monitoring, phenological shifts, Vietnam Mekong Delta, Sentinel-1, SAR1. Introduction
The Vietnam Mekong Delta (VMD), frequently referred to as Vietnam’s “rice bowl”, accounts for approximately 50% of Vietnam’s rice output and 90-95% of its exports (K.Linh, 2025). This low-lying region covers 40,500 km² and is inhabited by 21.5 million individuals, supporting a densely agricultural landscape mostly centered on rice agriculture, which underpins both livelihoods and ecosystems(Yen et al., 2019). Rice serves as the foundation of the VMD’s economy and ecology, with the region yielding 24–28 million tons each year (World Business Council for Sustainable Development (WBCSD), 2024). Over the recent decades, the delta has seen unparalleled problems, such as sea-level rise, saltwater intrusion, and land subsidence influenced by El Niño-Southern Oscillation (ENSO) events (Yen et al., 2019; Toan et al., 2021). The El Niño phases (e.g., 2015–2016, 2023–2024) intensify salt intrusion, resulting in salinity levels surpassing 4 g/L throughout 1.8 million hectares in 2020 (Yen et al., 2019; Bui Tan Yen et al., 2019; Toan et al., 2021). Conversely, extended La Niña occurrences (2020–2022) resulted in catastrophic floods, inundating 150,000 hectares of autumn-winter crops in 2020 (Yen et al., 2019). These factors threaten the ability of the delta to sustain its rice production and lead to the necessity of adopting adaptation and mitigation measures. For example, conventional cropping calendars have been modified: farmers now plant early during El Niño to circumvent drought and utilize short-duration varieties (85–95 days) to alleviate flood risks (Yen et al., 2019; Bui Tan Yen et al., 2019; Toan et al., 2021).
In this context, accurate rice mapping is critical for multiple stakeholders. To implement the “One Million Hectares Project” (CGIAR Initiative on Asian Mega-Deltas, 2024; IRRI, 2024) and devise strategies for climate change adaptation in the delta, government organizations—particularly Vietnam’s Ministry of Agriculture and Environment (MAE) and the provincial Departments of Agriculture and Rural Development—need rice maps. International organizations such as the ASEAN, FAO, and IRRI also use this to monitor food security and funding. Traditional monitoring methods relying on field surveys are labor-intensive and spatially limited, making satellite remote sensing essential for large-scale monitoring (Phi Phung et al., 2020; Zhao et al., 2021). Furthermore, accurate crop data is necessary for supply chain optimization, market intelligence, and precision farming solutions, which require detailed rice distribution for climate research and sustainable agriculture studies. Carbon market players and environmental organizations can gain from rice mapping to track the adoption of ecological agriculture and validate methane emission reductions from sustainable rice practices. Lastly, to develop capacity, analyze policies, and preserve regional food security throughout the nations of the Mekong Basin, regional coordinating organizations such as space agencies and the Mekong Institute require thorough data on rice monitoring.
The VMD’s complex agro-ecosystem—marked by a diversity of physical conditions (small, fragmented to large fields) and cultural practices (single, double, and triple cropping systems, with diverse crop calendars)—presents distinct challenges for remote sensing-based mapping (Duy Ba et al., 2016; Bui Tan Yen et al., 2019). Flooding during early growth stages, spectral similarities between rice and other vegetation, and persistent cloud cover complicate optical satellite-based approaches (Kersten Clauss et al., 2018; Bui Tan Yen et al., 2019). Consequently, SAR with systematic data acquisitions, particularly Sentinel-1’s C-band, has emerged as a vital tool due to its cloud-penetrating capability and sensitivity to morphological changes of rice (Bui Tan Yen et al., 2019; Phi Phung et al., 2020; Phan et al., 2021).
SAR’s all-weather imaging capacity is indispensable in the VMD, where cloud cover obscures 70–80% of optical data during the monsoon seasons (Bui Tan Yen et al., 2019; Phi Phung et al., 2020). Sentinel-1’s dual-polarization (VH/VV) and high temporal resolution (6–12 days) enable consistent monitoring of rice growth stages. The backscatter signal is susceptible to water management practices and plant structure: low VH/VV ratios (due to specular reflection over flooded fields), increasing to higher values as vertical rice stems dominate radar scattering (Duy Ba et al., 2016; Phan et al., 2021). Multi-temporal SAR data thus capture phenological signatures, such as tillering and booting stages, distinguishing rice from other crops (Nguyen Lam Dao et al., 2009).
Current approaches to classification of rice versus non-rice pixels in satellite imagery predominantly fall into two categories: machine-learning algorithms and threshold-based methods. Machine learning approaches, including Support Vector Machines (SVM) and Random Forest (RF), have been applied to SAR time series from Sentinel-1 (Onojeghuo et al., 2018; Thorp and Drajat 2021; Zhu et al., 2021; Sheng et al., 2022), sometimes in conjunction with optical time series from Sentinel-2 (Wang et al., 2022; Jiang et al., 2023; Onojeghuo et al., 2023; Zhao et al., 2024), and have demonstrated high classification accuracies (exceeding 95% in optimal conditions), but typically require substantial training data and computational resources (Onojeghuo et al., 2018). These methods excel at handling complex spectral and temporal patterns but may become impractical for large-scale operational monitoring across diverse regions. Most publications have applied these approaches only to limited test sites. Conversely, threshold-based methods, which consist of applying thresholds to indicators derived from the SAR time series, in particular, the maximum temporal increase of the backscatter observed during one season (Bouvet and Le Toan, 2011; Kersten Clauss et al., 2018; Phan et al., 2021) – offer computational efficiency and interpretability by exploiting rice cultivation’s distinct temporal backscatter patterns (K. Clauss et al., 2018). However, fixed thresholds often fail to account for variability in environmental conditions, sensor parameters, and agricultural practices across different regions. The constraints are especially evident when observing rice cultivation in extensive, diverse landscapes such as the VMD, where sensor viewing geometry, local agricultural practices, and environmental stressors fluctuate significantly in both space and time.
This article consolidates nearly a decade of Sentinel-1 observations (2016-2024) to deliver an unparalleled comprehensive analysis of rice production evolution in the VMD, documenting methodological advancements in SAR-based crop monitoring and quantifying the region’s agricultural transformation in response to climate variability. This comprehensive historical research demonstrates how the VMD’s rice production systems have adjusted to intensifying environmental pressures, such as ENSO-induced drought and flood cycles, saltwater intrusion incidents, and changing precipitation patterns.
This article introduces two novelties that advance operational rice monitoring in the VMD with Sentinel-1:
- Methodological improvement in detecting rice using SAR C-band with customised threshold functions that adjust for changes in Sentinel-1’s angles (31°- 46°), which improve on older methods that use fixed thresholds.
- Better understanding the changes in the VMD’s rice cultivation over the past decade (2016-2024) with the annual crop intensity maps/ seasonal sowing dates estimations, and the associations with environmental or climate-change factors (such as ENSO events and salinity).
These methodological advances and long-term observations provide critical insights for understanding agricultural system resilience and inform evidence-based policy decisions for sustainable rice production under accelerated climate change. The integration of high-resolution temporal monitoring with adaptive thresholding establishes a robust framework that can be extended to other rice-producing regions facing similar environmental challenges.
2. Material and Methods
2. 1 Materials
2.1.1 Study Site
This delta originally comprised of 13 provinces (Fig. 1a), but after July 1st, 2025, the Vietnamese government reduced it to five provinces in order to streamline the administrative apparatus (Fig. 1b) without Long An. Since this work studied the evolution of rice cultivation in the VMD before this change, all the analyses and discussions throughout the study are based on the old map.

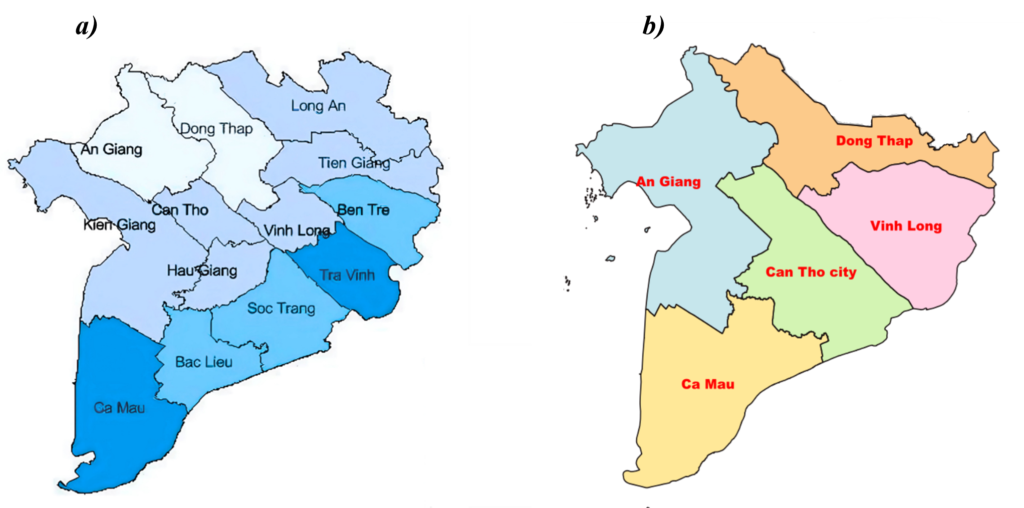
Fig. 1 Vietnam Mekong Delta map before (a) and after July 1st 2025 (b) following the merging of provinces
Traditionally, farmers leverage three distinct cropping seasons to maximize land use (shown in Fig. 2):
+ Đông Xuân (Winter–Spring): Sown in November–December, this dry-season crop relies on controlled irrigation to avoid salinity intrusion and brings the highest yield (≈ 7.2 t ha-1) thanks to sunny conditions and intensive water management.
+ Hè Thu (Summer–Autumn): Sown in April–May at the onset of the monsoon, it is the main wet-season crop under heavy rainfall. Harvested in August–September before flood peaks. Yields average around 5.2 t ha-1.
+ Thu Đông (Autumn–Winter): Sown in August–September, as an “off-season” crop, it grows short-cycle varieties (85–90 days) in flood-protected zones. Yields are lower due to tight timing, higher pest pressure, and residual flood risks.

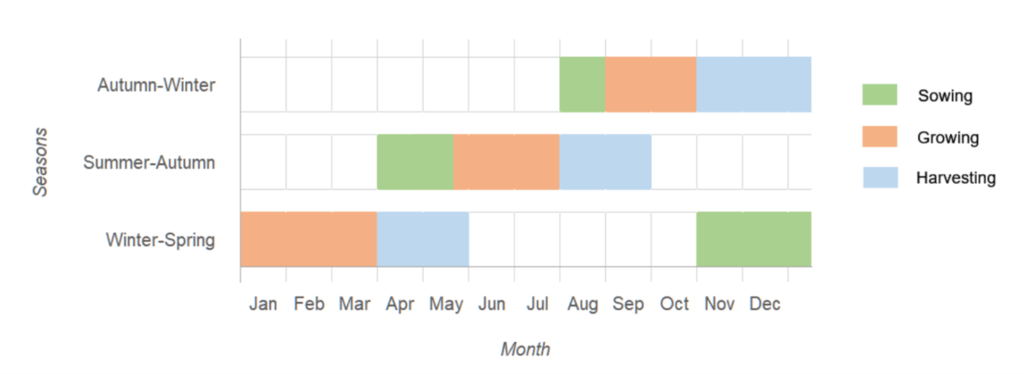
Fig. 2 Three main rice crops in the VMD and their respective traditional practice calendars
Rice cultivation in the Mekong Delta of Vietnam predominantly employs direct wet seeding methods, with most farmers utilizing broadcast seeding of pre-germinated seeds onto moist soil, followed by controlled flooding approximately 20-21 days post-sowing (Yu et al., 2019; Nguyen et al., 2022; Sonal Gupta et al., 2023; Le Viet Phu and Do Truong Phuong Lam, 2023; Van Hung et al., 2024; Quynh Chi, 2024). This traditional practice typically incorporates short-duration, high-yielding rice varieties such as IR 50404 (80-86 days) and OM 4218 (90-97 days), facilitating intensive triple-cropping systems and rapid field turnover between growing seasons (Phan et al., 2018; Le Viet Phu and Do Truong Phuong Lam, 2023; Quynh Chi, 2024). The conventional broadcast seeding method necessitates substantial seed rates, often exceeding 180 kg ha⁻¹, and requires water levels of 1-3 cm during initial growth stages before establishing permanent flooding for weed suppression (Yu et al., 2019; Ogawa et al., 2022; Van Hung et al., 2024). However, there is a noticeable trend among progressive farmers towards adopting higher-quality, longer-duration rice varieties such as Jasmine 85 (95-110 days) and premium OM varieties, which yield significantly higher market prices despite their extended growing cycles (Nguyen et al., 2012; Phan et al., 2018; Quynh Chi, 2024). Additionally, a small but growing number of operations are implementing mechanized transplanting and precision seeding technologies, including drum seeding and mechanized direct, which reduce seed consumption by 61-83% (Van Hung et al., 2024) while maintaining comparable yields.
2.1.2. Data descriptions
2.1.2.1. Image data
This study exploited Sentinel-1 C-band SAR data from October 2015 to 2024, including the whole the VMD region. The Sentinel-1 constellation, consisting of S1A and S1B, delivered dual-polarization (VH+VV) Ground Range Detected (GRD) products in Interferometric Wide (IW) swath mode with a spatial resolution of 10 meters (“Sentinel-1 GRD,” n.d.) (Fig. 3).
In the extensive, low-lying geography of the VMD, employing Sentinel-1 images from a uniform orbital direction—specifically descending mode in this analysis—offers considerable benefits over the mixed-orbit methods. Consistent orbit selection guarantees equal incidence angles and gaze direction throughout the research zone, reducing backscatter variability that might complicate temporal analysis (“S1 Applications,” n.d.; Kumar et al., 2022). Using singular orbital direction images avoids angular artifacts in backscatter time series and distinguishes phenological signals from geometric variability from different viewing geometries. This reduces multi-orbit data fusion residual noise and geometric harmonization computing burden, improving operational and processing efficiency. The integration of ascending-descending acquisitions creates temporal artifacts from morning and evening plant activity, dew generation, and solar influence, reducing crop phenology detection reliability.

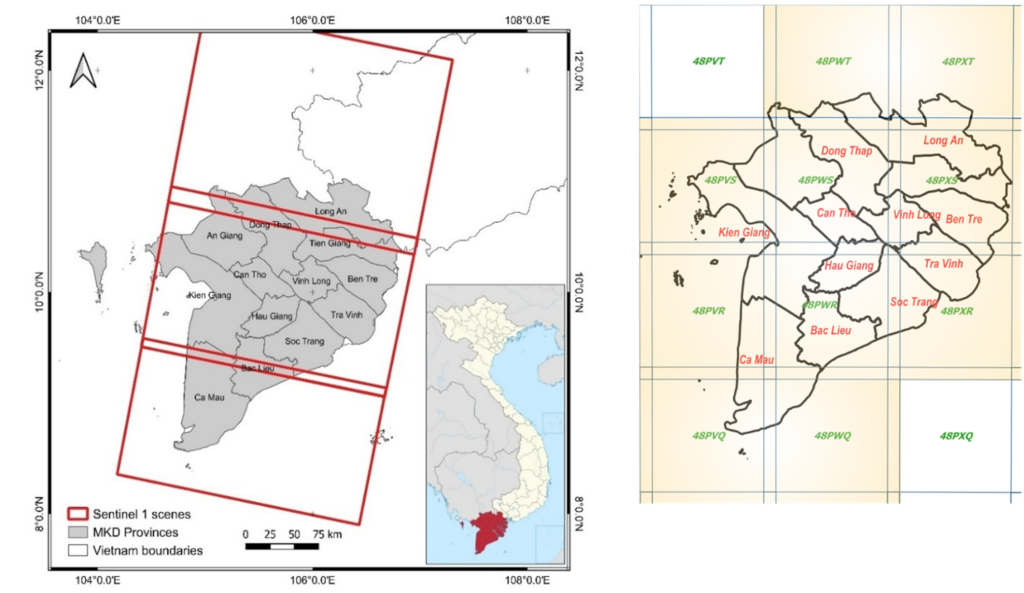
Fig. 3 The Vietnam Mekong Delta with Sentinel 1 scenes overlaid is covered by 10 tiles in S1Tiling
The French Spatial Agency (CNES)-developed S1Tiling software (“S1Tiling 1.0.0rc2 Documentation,” n.d.) was used for Sentinel-1 GRD pre-processing. It provides an efficient and automated procedure that includes calibration, orthorectification, and systematic organization of SAR imagery. Initially, the data underwent radiometric correction to the sigma nought (σ0[dB]) backscatter coefficient to mitigate the impact of the incidence angle range (31°- 46°) over the research area. Eliminating thermal noise simultaneously reduced system-induced artifacts. Multi-looking in the ground range reduced preprocessed data speckle noise(“Sentinel-1 GRD,” n.d.).
Orthorectification uses Range-Doppler terrain correction and SRTM-GL1 geometric correction. SRTM GL1 30m provides appropriate resolution, radar compatibility, clean, void-filled data, and easy interaction with S1Tiling over flat but hydrologically complicated terrain like the VMD. This DEM is trustworthy and efficient for Sentinel-1 data geometric rectification and time-series analysis (Rodríguez et al., 2006; Minderhoud et al., 2019; Earth Science Data Systems and NASA, 2025). Optical data integration and homogenous spatial coverage were achieved by automatically truncating preprocessed scenes to fit Sentinel-2 tiling (Alexandre et al., 2020). Finally, a multi-temporal filter (Quegan and Yu, 2001) was applied in order to reduce speckle noise further while preserving the spatial resolution.
For time series analysis, preprocessed pictures were structured into a dataset with all backscatter coefficients and spatial and temporal dimensions. When both S1A and S1B were working, the dataset had 6-day revisit intervals, but when only one satellite was working (2016 and post-December 2021, due to S1B failure), it had 12-day intervals.
The study included 1200 rice field samples (shown in Fig. 4) and 800 non-rice object samples from the VMD region to reflect a variety of growing environments and agricultural techniques. Among the rice samples, 85 fields were collected during field trips. The rest were visually selected based on their appearances in the historical optical imagery of Google Earth Pro (Google, n.d.), and rigorously reviewed against the Sentinel-1 backscatter time series from late 2015 to 2024 to ensure continued rice cultivation. Each sample includes a rice paddy field (at least 300 m²). The example fields must meet these criteria:
2.1.2.2. Sample data and ground data
The study included 1200 rice field samples (shown in Fig. 4) and 800 non-rice object samples from the VMD region to reflect a variety of growing environments and agricultural techniques. Among the rice samples, 85 fields were collected during field trips. The rest were visually selected based on their appearances in the historical optical imagery of Google Earth Pro (Google, n.d.), and rigorously reviewed against the Sentinel-1 backscatter time series from late 2015 to 2024 to ensure continued rice cultivation. Each sample includes a rice paddy field (at least 300 m²). The example fields must meet these criteria:

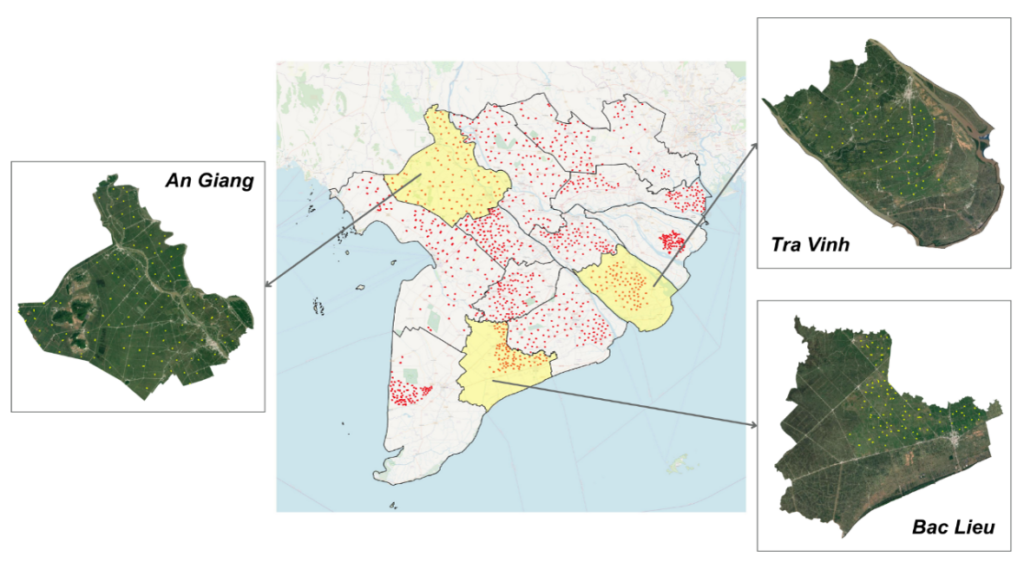
Fig. 4 The distribution of 1200 sample rice fields throughout the MKD. An Giang, Bac Lieu and Tra Vinh are the provinces where the ground data were collected
- Its backscatter temporal profile shows a visible rice seasonal pattern (Fig. 5), with each season lasting for at least 90 days (short-cycle rice)
- The minimum VH backscatter value of each season must be below -19 dB (representing the flooding at the early stage)
- There was no sign of inter-cropping of other crop types between seasons in one year (to avoid confusing rice with other vegetation crops).

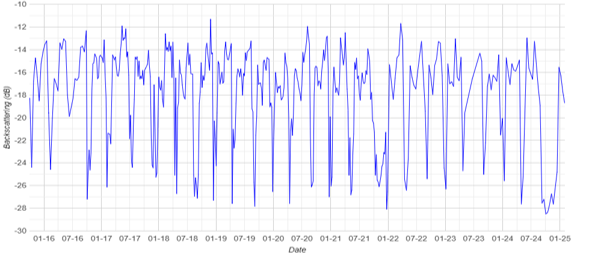
Fig. 5 An example of VH backscattering time series of a rice field sample in An Giang with triple crops during 2016-2020, 2022-2023 and double crop in 2021, 2024
- Collection of Ground Data
Three representative provinces—An Giang, Bac Lieu, and Tra Vinh—were the focus of the ground sample collection strategy. These provinces were chosen due to their varied incident angles in Sentinel-1 imagery (centered around 44°, 37°, and 31°) to allow for a comprehensive investigation of backscatter temporal profiles under diverse incidence angles. An Giang in the upper delta has extensive triple-cropping systems, Bac Lieu in the coastal area has rice-aquaculture rotation, and Tra Vinh has typical double-cropping.

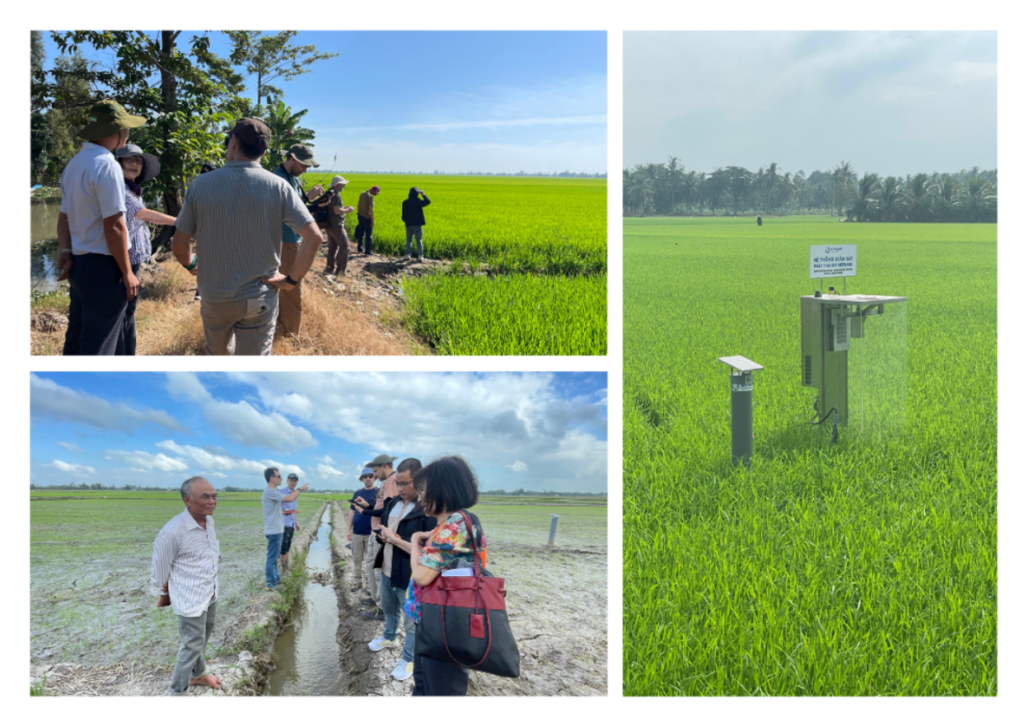
Fig. 6 Gound data collection in some rice fields in An Giang, Bac Lieu & Tra Vinh.
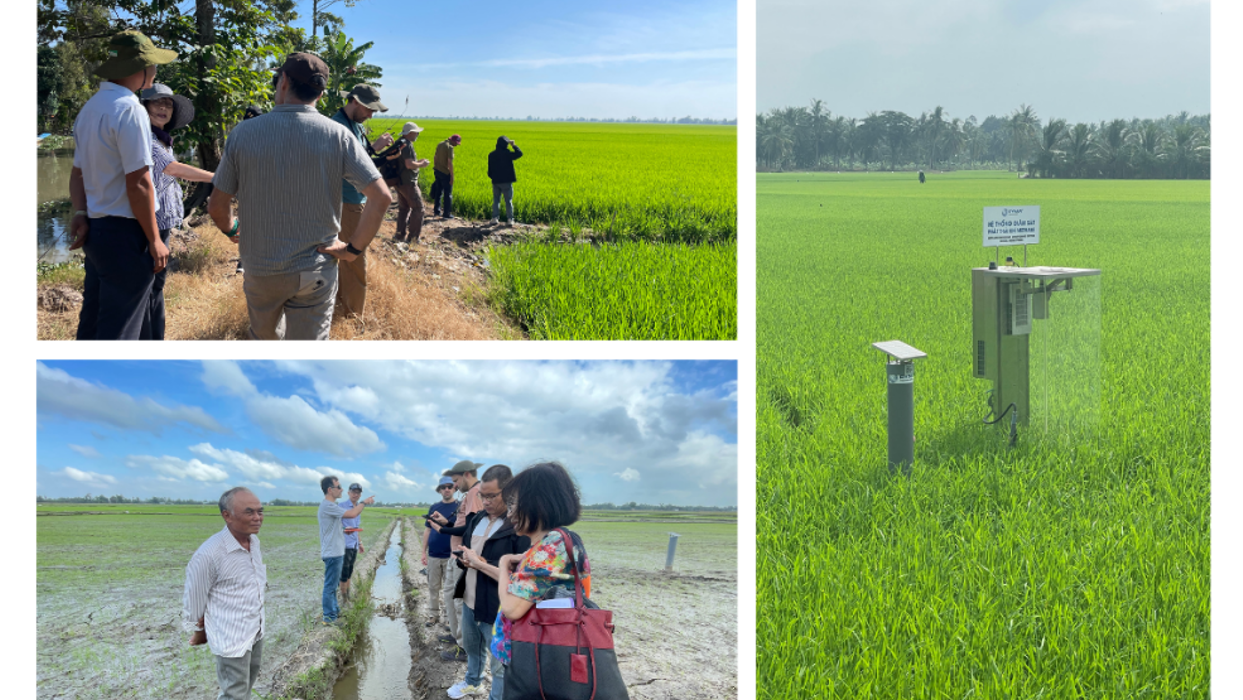
The nine-year study span made ground observations at the same locations difficult. About 85 fields in the three targeted provinces provided recent ground truth data from 2024 to 2025. Through farmer interviews and interactions with local agricultural groups, these sites obtained comprehensive agricultural data. This data covered sowing dates, harvesting intervals, Alternate Wetting and Drying (AWD) methods, rice varietals, and growth lengths. (Fig. 6)
- Sample dataset organization
The complete sample collection was systematically divided into two halves for separate analytical purposes. For training, the first subset of 600 fields was used. The remaining half, including 85 fields with current ground truth data, was designated for validation and accuracy assessment of the classification results.
Despite the scarcity of continuous ground observations, the Sentinel-1 time series analysis, which confirmed the temporal regularity of rice cultivation at these sites, provided trustworthy training data for the classification algorithm.
3. Theory
3.1. Principle of rice detection with SAR
Previous studies, such as Bazzi et al., 2019 and Xu et al., 2023 (Fig. 7a), evidenced that the VH backscatter temporal profile in a rice season has a unique pattern when compared to other crop types. Rice’s VH backscatter is noticeably low in the early phase when the fields are flooded, then steadily increases due to plant height, soil moisture, and structure. Finally, it reduces gradually when rice plants start to bend down. Phan et al., 2021 (Fig. 7b) mentioned that the sowing date can be estimated only after about 20-24 days (corresponding to 4 Sentinel-1 images of 6 days revisit), as it is necessary to wait until the VH/VV ratio reaches its minimum and starts increasing again. The VH/VV temporal profile peaks 60 days after sowing, when rice plants reach their maximum height. This principle serves as the foundation for the sample selection in this work

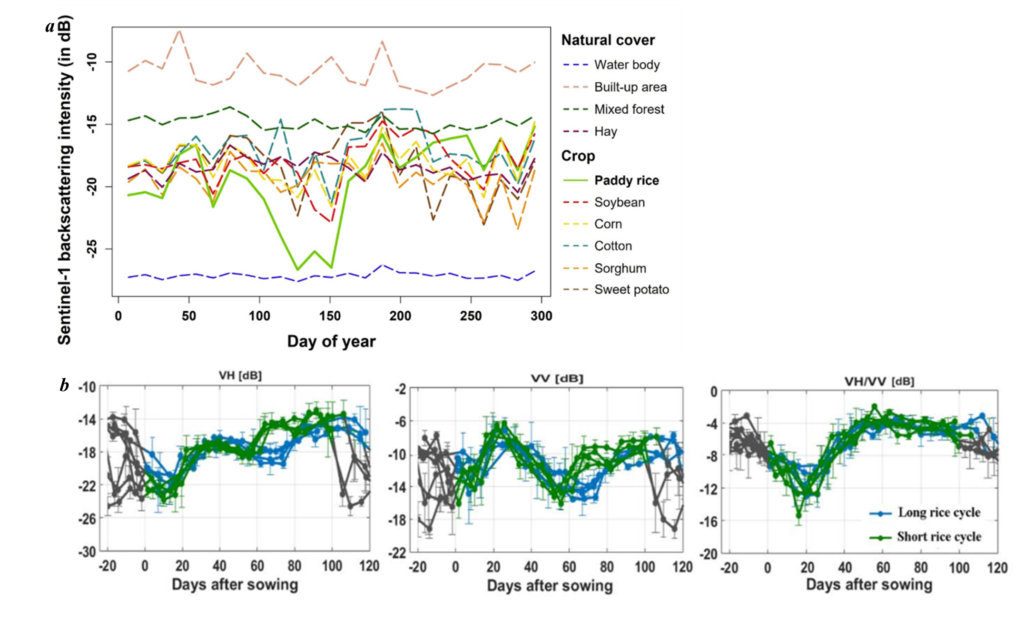
Fig. 7. Comparisons between the Sentinel-1 backscattering temporal profile of rice and other crop types in VH (source: Xu et al., 202343) and (b) the local minimum of VH/VV on around 20th day for sowing date estimation (source: Phan et al.,202112).
3.2. Incident angles effects
While the VH/VV ratio provides clear phenological signatures, Phan et al., 2021 suggested using the VH backscatter increase within a season as a classification feature to discriminate rice fields from other land use classes. A significant limitation of Sentinel-1 for such approaches lies in its variable incidence angles (31°–46° across the VMD), which alter backscatter coefficient values (σ° [dB]) for the same land cover (Nguyen Lam Dao et al., 2009; Duy Ba et al., 2016). For instance, σ°(dB) in mature rice fields decreases by 0.2–0.5 dB per degree increase in incidence angle due to reduced double-bounce scattering, and also the cosine variation of volume scattering (Duy Ba et al., 2016; Topouzelis et al., 2016; Arellano et al., 2019; Kaplan et al., 2021). This variability introduces classification errors when fixed thresholds are applied universally. Study by Phan, 2018 demonstrated that VH backscatter temporal profiles differ markedly between An Giang (44° incidence) and Ben Tre (31°), with the latter showing higher σ°(dB) variability. Such discrepancies necessitate localized calibration to avoid misclassifying urban or water pixels as rice.

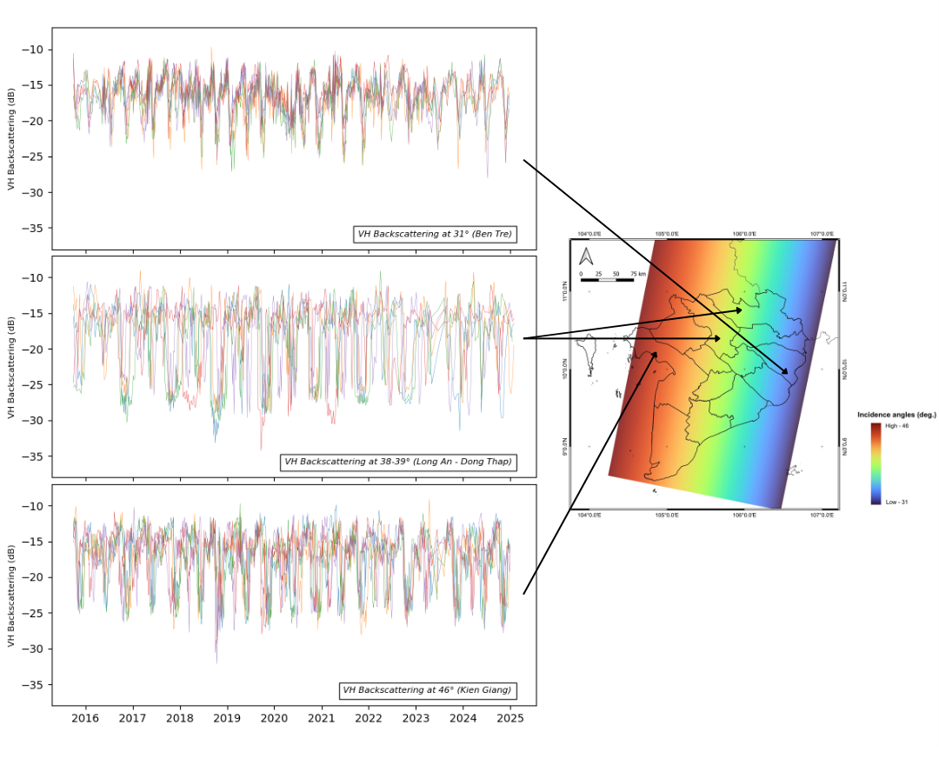
Fig. 8 MKD covers a wide range of Sentinel-1 incidence angles. A comparison of rice VH backscatter’s temporal profiles at 3 areas with different incidence angles
To address these incidence angle limitations, some past studies have applied an incidence angle normalization on wide-swath SAR images in the form of linear (Duy Ba et al., 2015) or polynomial (Phi Phung et al., 2020) regressions. However, the dependence of the backscatter on the incidence angle relies on several factors (thermal noise pattern, angular behavior of water surfaces, angular behavior of rice canopy, etc.), which are difficult to model and will vary with the phenological stage. It can therefore not be adequately corrected using a single correction (e.g., linear or polynomial regression) applied to each image. Instead, we propose directly analyzing the angular dependency of the calculated classification feature, i.e., the VH backscatter increase within one season, to empirically find the optimal threshold value for rice classification at each incidence angle.
The Fig. 8 displays VH backscatter temporal characteristics at three distinct incidence angles in the VMD:
- Low Incidence Angle (31° – Tra Vinh/ Ben Tre): VH backscatter range -21 dB to -12 dB, maximum amplitude between peaks and troughs, most significant temporal fluctuations, maximum increase: approximately 6-7 dB.
- Moderate Incidence Angle (37° – Bac Lieu/ 38-39° – Long An): VH backscatter range -32 dB to -13 dB, moderate amplitude fluctuation, maximum increase: around 8-9 dB, more distinct seasonal trends.
- Elevated Incidence Angle (44° – An Giang/ 46° – Kien Giang): VH backscatter range -25 dB to -13 dB, reduced amplitude between peaks and troughs, consistent temporal pattern with reduced variability. Peak-to-trough maximum increase: around 7-8 dB.
4. Methodology
The method to map rice fields and rice sowing date adopted in this article builds upon a previous study by Phan, 2018, which suggested that in the VMD, rice fields can be detected by applying a threshold on the maximum increase observed in VH backscatter time series over a season. The sowing dates can be estimated using the time series of the ratio of VH to VV (VH/VV ratio). Two caveats were identified. First, in order to calculate the maximum increase over a season, the typical crop calendar must be known (such as the one in Fig. 2). However, the dates of each season at a given location can change significantly from one year to another, for example, to follow local predictions for climate events. Therefore, there is a need to develop an approach capable of automatically detecting the dates of the rice season. For large-scale applications, variations in incidence angle within a Sentinel-1 image affect the backscatter values and, consequently, the thresholds to be applied to the maximum increase features. This indicates that “angle-dependent” thresholds should be used instead of fixed thresholds.
The present study aims to propose an approach that addresses these two caveats. After a first step where non-rice areas are masked out and the remaining areas are marked as potential rice pixels, an automatic detection of rice seasons is developed based on a year-long time series of the VH/VV ratio (section 4.1 – Fig. 10). The resulting cropping intensities are consolidated by detecting rice fields using “angle-dependent” thresholds on the VH maximum increase within each season (section 4.1.1.2. The methodology is summarized in Fig. 9.

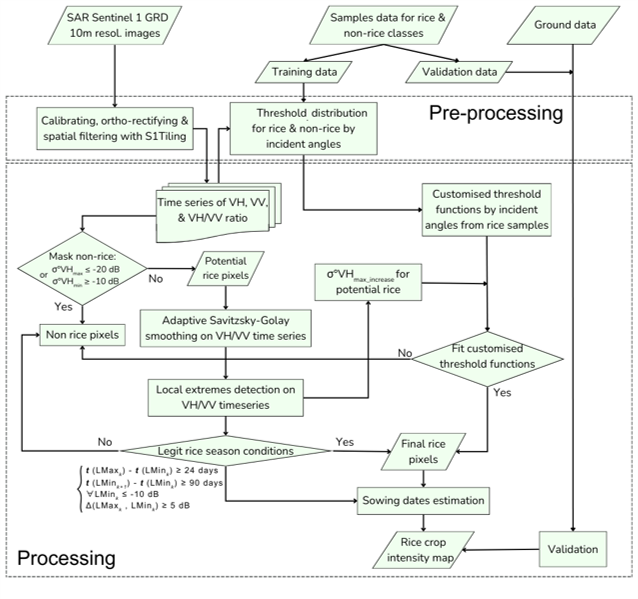
Fig. 9 Flow chart illustrates this study’s method processing steps
- Mask out non-rice pixels to retrieve potential rice pixels
Prior to rice classification, non-rice pixels can be masked using their distinctive backscatter characteristics in SAR imagery. Water bodies consistently exhibit very low backscatter values due to specular reflection, with VH values typically below -20 dB (Tian et al., 2023). Urban areas and artificial structures, conversely, maintain consistently high backscatter values throughout the year due to strong double-bounce scattering from buildings and infrastructure (K. Clauss et al., 2018). Natural vegetation and forests also show relatively stable high backscatter values due to volume scattering from their canopy structure, typically ranging from -8 to -15 dB in VH polarization and -2 to -13 dB in VV polarization for dense forest areas (Arellano et al., 2019; Ma et al., 2023; Escobar-Ruiz et al., 2024). These values show minimal variation across Sentinel-1’s incidence angle range since the cosine correction factor between 30° and 46° incidence angles (cos 30° = 0.866 vs cos 46° = 0.695) represents only a 20% difference that is largely absorbed by the natural variability in volume scattering mechanisms (Topouzelis et al., 2016; Arellano et al., 2019; Kaplan et al., 2021; Zhang et al., 2021).
The masking process involves a two-step thresholding approach. First, water bodies are eliminated using their characteristically low VH backscatter values (average σ° ≤ -20 dB) (Bouvet et al., 2009; Tian et al., 2023). Then, built-up areas and permanent vegetation are masked out using their minimum VH backscatter values throughout the time series, as these remain consistently above -10 dB. This dual thresholding removes most non-agricultural pixels, leaving primarily cropland areas for subsequent rice detection analysis (Ma et al., 2023). However, some confusions persist where backscatter values overlap between different land cover types. For instance, newly planted rice fields with standing water can exhibit backscatter signatures similar to permanent water bodies (-28 to -20 dB). In comparison, mature rice approaching harvest may show backscatter values comparable to other vegetation types (-17 to -12 dB)41. To address these ambiguities, temporal analysis of backscatter patterns becomes crucial, as rice exhibits distinct temporal variations compared to other land covers, particularly in the VH polarization(Phan et al., 2021; Bouvet et al., 2009). The effectiveness of this masking approach has been demonstrated across various studies in the VMD, achieving classification accuracies exceeding 85% when combined with subsequent temporal analysis (K. Clauss et al., 2018).
4.1 Automatic detection of rice season dates
When compared to individual VH or VV polarizations, which exhibit relatively complex backscatter variations within one rice season, the VH/VV ratio recorded in rice fields provides a time series that has a relatively simpler and more visible behavior (Phan et al., 2021) (Fig. 7b). This ratio normalizes ambient backscatter variations while enhancing structural changes in the rice growth stage. Although these VH/VV profiles resemble those observed in other cereal crops (Veloso et al., 2017) and are therefore less suitable for rice detection than VH or VV temporal profiles because of potential confusion with other crops, they match the rice phenological development (Bazzi et al., 2019) and can be used to accurately estimate rice season dates.
The rice sowing event generates a marked change in canopy structure and water–vegetation interactions, which both VH and VV channels capture. By taking the ratio, common-mode fluctuations—such as soil moisture dynamics, incidental rainfall, or atmospheric effects—are largely canceled out, while the relative enhancement of VH/VV during early vegetative stages produces a distinct rise that aligns closely with the emergence of seedlings (Fig. 7b). The ratio exploits the complementary scattering behavior of the two polarizations, enhances radiometric robustness, and sharpens the hydrological signature of paddies. These characteristics provide a more dependable indicator for identifying the starting point (a.k.a. sowing date) of rice cultivation compared to the conventional VH time series.
In contrast, rice identification throughout the crop cycle benefits more from using VH polarization alone, because VH backscatter is highly sensitive to multiple scattering within the rice canopy—particularly the interaction of radar waves with vertical stems and leaves—and thus provides strong discrimination between rice and non-rice classes. Thus, to obtain more precise VH customised thresholding functions later, the VH raw time series should be preserved for accurate backscatter variation (used to determine VHmax-increase). Hence, a smoothing filter is applied only to the VH/VV ratio time series for easier detection of sowing dates.
4.1.1 Adaptive Savitzky-Golay smoothing
The Savitzky-Golay smoothing preserves typical temporal patterns and reduces noise, making local extrema corresponding to major phenological transitions in rice growth cycles easier to spot (Ma et al., 2023). Conventional Savitzky-Golay (SG) filtering, which uses fixed window lengths, is insufficient for handling heterogeneous temporal profiles. Hence, the Adaptive Savitzky–Golay (ASG) (Ochieng et al., 2023) smoothing algorithm was implemented to tackle the issue of fluctuating temporal patterns in rice cultivation throughout the VMD, where cropping intensities vary from single to triple crops per year.
The algorithm determines the optimal window length for each pixel through a three-step process (Fig. 10):
- Fig. 10a: identify the FFT dominant frequency (in days) of a pixel’s yearly time series
- Fig. 10b: evaluate the detected FFT period against the data acquisition interval and select the lesser value (Tian et al., 2023; “Sentinel-1 GRD,” n.d.)
- Fig. 10c: optimal adaptive window length is the nearest odd integer that meets or exceeds the selected temporal interval (Tian et al., 2023)
The efficacy of adaptive SG smoothing is notably evident in regions with mixed cropping intensities (Fig. 10), where fixed-window methods may either excessively smooth triple-cropping patterns or insufficiently smooth single-cropping signals. The algorithm performs well in the VMD’s varied agricultural settings, making it easier to identify specific rice growth stages and enhancing the accuracy of mapping crop intensity.

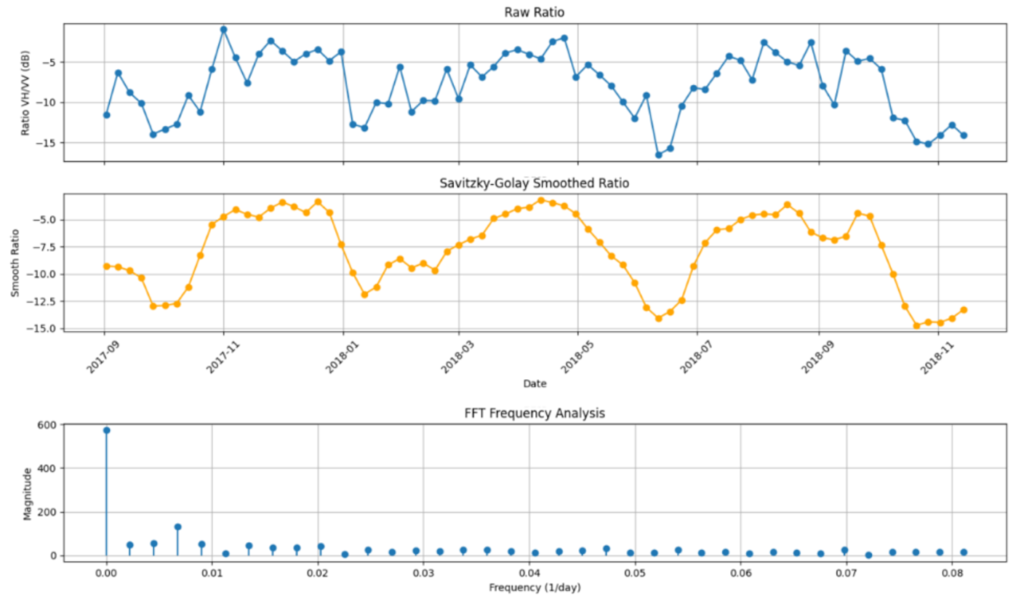
Fig. 10 Example of a rice pixel’s VH/VV ratio time series after applying the ASG filter defined by three steps
4.1.1.2. Seasonal patterns detection & sowing dates estimation
As evidenced by Phan, 2018, the temporal evolution of Sentinel-1 VH/VV ratio backscatter provides a direct proxy for rice phenological development due to its sensitivity to structural and hydrological changes in rice fields. During the first twenty days after sowing, while the young rice plants grow over moist soil, the rice canopy becomes denser, and an attenuation in volume and double-bounce scattering is observed, which is more important at VV than at VH because of the vertical structure of the rice plants, leading to an increase in the VH/VV backscatter until about 65 days after sowing, where it reaches a plateau until harvest. These temporal behaviors (decrease of VH/VV during the first 20 days followed by an increase) result in a typical pattern that repeats cyclically up to three times a year for triple cropping systems, for instance, generating three identifiable seasonal windows separated by 90–120 days (Duy Ba et al., 2015).
Algorithmically, sowing dates are derived by backtracking 20 days from the local minimum of VH/VV (Fig.11b). This interval accounts for:
- Seedling establishment: 20 days post-sowing under direct-sowing practices
- Early tillering: 10–14 days until radar-detectable biomass accumulation.
- Finally, temporal constraints require valid seasonal windows: consecutive local minima must be ≥ 90 days apart (Fig.11a), and backscatter amplitude differences (max−min) must exceed 5 dB to filter false positives from non-rice land covers(Duy Ba et al., 2015).

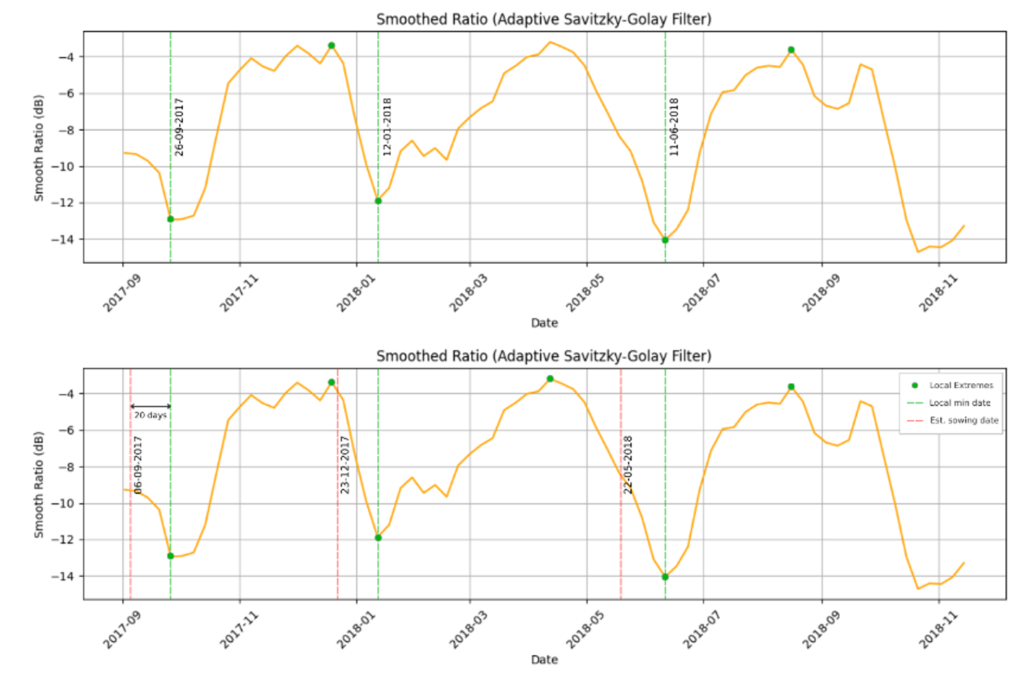
Fig.11 Local extremes detection on an ASG smoothed ratio time series. a) Green vertical lines show the dates on which local minima were detected b) Dashed red vertical lines show dates traced back 20 days from the dates in (a)
4.2. Rice detection using VH backscatter increase and incidence “angle-dependent” thresholds
Generally, the maximum backscatter values observed in rice fields at different incidence angles are relatively stable (around 12-13 dB), but the minimum backscatter values differ drastically: from –32 dB to –21 dB. This can be explained by the fact that the backscatter of the water surfaces varies with the incidence angle and is also affected by the thermal noise patterns in the three sub-swaths of Sentinel-1, even though a thermal noise correction is applied. As a consequence, the VH backscatter increase is also severely affected by the incidence angle. The consistent fluctuation in backscatter response at different incidence angles requires an “angle-dependent” threshold method for precise rice detection in the VMD. To develop customized threshold functions for rice detection, the VHmax_increase parameter must first be computed for each potential rice pixel.
Fig. 12 demonstrates the two-step process for computing VHmax_increase.
- Fig. 12a panel shows the smoothed VH/VV ratio time series after applying the Adaptive Savitzky-Golay filter, with local minima and maxima clearly identified, as explained in Section 4.1. The green shaded area represents a seasonal window, from approximately 25 days before a local minimum to the following local minimum in the ratio time series.
- Fig. 12b panel displays the raw VH backscatter time series, where the seasonal window identified from the ratio analysis is projected (green shaded area). Within this window, local extremes in the VH signal are detected to compute the VHmax-increase, which is defined as the difference between the maximum and minimum VH backscatter values during the rice growing season. This approach ensures that the temporal dynamics specific to rice cultivation are captured while minimizing confusion with other land cover types.

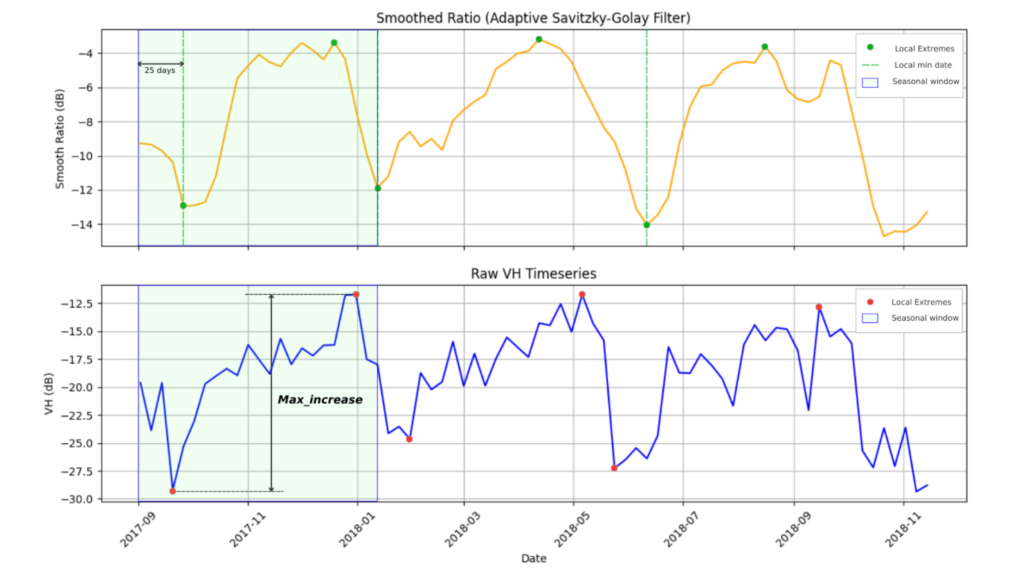
Fig. 12 Illustration of how the VHmax_increase is computed
An empirical analysis of the 1,200 sample fields described in Section 2.1.2.2 revealed significant incidence angle (θ) effects on backscatter metrics. Fig 13 shows box plots of the VHmax-increase parameter in the rice pixels and in the non-rice pixels, per 1° incidence bins for the three rice crops in 2023. The VHmax-increase of the rice pixels generally shows lower values for the extreme near-range and far-range incidence angles (around 9dB) and higher values in intermediate incidence angles (around 12dB). The VHmax_increase of the non-rice pixels remains relatively stable around 3dB. The study by Bouvet et al., 2010 showed that for classification methods based on SAR intensity ratios, the optimal threshold to distinguish between two classes is the geometric mean between the intensity ratios of the two classes, and therefore the arithmetic mean when these intensity ratios are expressed in dB. Based on this same concept, the distinguishing threshold is retrieved from the collected samples. Fig 13 shows a quadratic polynomial fit of this optimal threshold (in green):
Δ_threshold=〖aθ〗^2+bθ+cThese customized threshold functions were computed annually to account for the significant evolution of rice cultivation practices throughout the study period. Each annual function was derived from the VH backscatter time series spanning three main rice seasons: Winter-Spring (WS), Summer-Autumn (SA), and Autumn-Winter (AW). A complete annual cycle typically extends from September of the preceding year through November of the current year. However, these temporal boundaries may shift based on the detection of local minima in the backscatter profiles. The customized threshold functions of all years (2016-2024) are shown in Fig. 14.
For a given year, the optimal classification threshold varies by more than 1.5dB between extreme and intermediate incidence angles, and for a given incidence angle, the optimal classification threshold varies by about 0.5dB between years. This indicates that accounting for incidence-angle variability is more important than interannual variability.
The temporal variation in these functions may reflect the adaptation of rice practices to environmental stressors, particularly during extreme events such as the 2015-2016 El Niño and the 2020-2022 La Niña episodes. The functions demonstrated higher thresholds during years with favorable growing conditions and lower thresholds during stress periods, when reduced biomass development and reduced water availability resulted in diminished increases in backscatter.

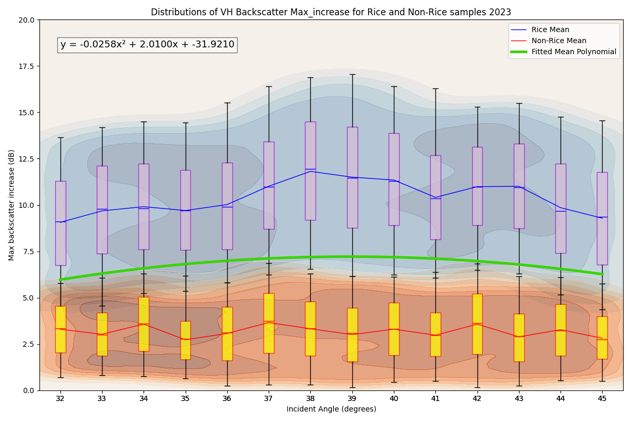
Fig 13 The distributions of VHmax_increase for rice (blue/purple) and non-rice (orange/yellow) samples per 1° incidence bins for the year 2023. The blue and red lines represent the mean values, and the green curve is a polynomial of the optimal classification threshold to distinguish between rice and non-rice, defined as the average value (in dB) of the mean values of VHmax_increase in the rice and non-rice classes
5. Results
5.1 Threshold functions by year
Fig. 14 displays the customized threshold functions for rice detection across different years (2016-2024), showing the relationship between backscatter VHmax_increase and incidence angles. Each curve represents a distinct year’s threshold function, with notable parameter variations. The functions consistently show quadratic shapes with peaks around 37-39 degrees incidence angle, where the VHmax_increase threshold reaches approximately 7.5-8.0 dB. The 2018 function (yellow curve) exhibits the highest threshold values across all incidence angles, while the 2022 function (pink curve) shows the lowest thresholds. At near-range (31°) and far-range (46°) incidence angles, the threshold values decrease to around 6.0-6.5 dB, reflecting the reduced sensitivity of VH backscatter at extreme viewing geometries. The convergence of most curves between 2016 and 2022 suggests relatively stable rice cultivation practices during this period, while the distinct deviation of the 2023 curve likely indicates adaptation to the strong El Niño conditions that emerged that year. The year 2022 is a special case, as its function was the lowest among all years. This is due to the fact that, during the dry seasons 2021-2022 and 2022-2023, the VMD witnessed earlier and more severe salinity intrusions compared to the previous years (Chi Linh, 2022; Hung Vo, 2022; van Aalst et al., 2023). Additionally, throughout 2022, several projects were launched by the government and collaboration teams to promote low-GHG-emission rice production (Minh Dam et al., 2021; Leon Ai and Izumi Taro, 2022; SNV Netherlands Development Organisation, n.d.). These projects were implemented in key rice landscapes (An Giang, Kien Giang, Dong Thap, and Tra Vinh), where AWD and other sustainable rice production technology packages were experimented with. The combination of strong salinity intrusions and AWD application on a large scale narrows the variation between the local minimum and local maximum backscatter (a.k.a VHmax_increase), forming the 2022 customized threshold function low despite being in a La Niña phase.

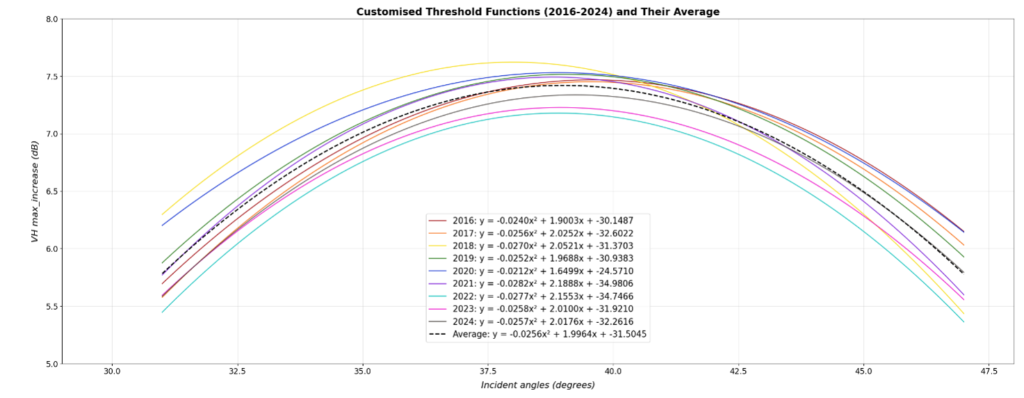
Fig. 14 Combination of 8 annual customized threshold functions for the 2016-2023 period
5.1.1 Automatic detection of rice seasons and calculation of the VH maximum increase
Rice cultivation in the VMD comprises diverse cropping practices from one season per year (single crop) to an intense triple-crop per year. Besides changing based on the hydrological system and topographic characteristics of sub-regions, the number of annual crop intensities also reflects adjustments in rice practices in response to various factors, including hazardous events (drought, flood, salinity, etc.), policy modifications, climate-smart and sustainable practice methods. Rice crop intensity mapping gives insights into the interannual and long-term evolution of the VMD’s rice production. The complex and variable cropping intensity in the VMD represents a challenge for the automatic detection of rice seasons from Sentinel-1 time series.
As evidenced by Phan, 2018, the temporal evolution of the Sentinel-1 VH/VV ratio backscatter provides a direct proxy for rice phenological development due to its sensitivity to structural and hydrological changes in rice fields. During the first twenty days after sowing, while the young rice plants grow over flooded soil, the VV and VH backscatter becomes dominated by a strong double-bounce mechanism, which is more important at VV than at VH, and to a lesser extent by volume scattering. After that, the rice canopy becomes denser, and an attenuation in volume and double-bounce scattering is observed due to the vertical structure of the rice plants, leading to an increase in the VH/VV backscatter until approximately 65 days after sowing, after which it reaches a plateau until harvest. These temporal behaviors (decrease of VH/VV during the first 20 days followed by an increase) result in a bell-shaped pattern that repeats cyclically up to three times a year for triple cropping systems, for instance, generating three identifiable seasonal windows separated by 90–120 days(Duy Ba et al., 2015).
5.2. Assessment of the classification algorithm & Validation
5.2.1 Accuracy of the threshold functions by the samples
The classification accuracy of the customized threshold functions was rigorously evaluated using the reserved 600 validation samples distributed across the VMD region. Fig. 15 illustrates the temporal evolution of classification performance from 2016 to 2024, revealing substantial variations in accuracy metrics across different years. The highest overall accuracy at pixel level was achieved in 2021-2022, with values consistently exceeding 95%, coinciding with the period of moderate ENSO conditions when rice cultivation practices remained relatively stable. By contrast, the lowest pixel-base accuracy (90.5%) was observed in 2020, following a period during which significant changes in cropping patterns and water management practices were observed. This reduced performance likely stems from anomalous backscatter signatures associated with drought-stressed rice plants and modified irrigation schedules. The more recent years (2023-2024) show a slight decline in accuracy to approximately 92-94.5% on pixel level, potentially reflecting the increasing complexity of agricultural adaptation strategies in response to environmental stressors. This spatial discrepancy validates the necessity of the incidence – “angle-dependent” threshold approach, as the polynomial functions performed best in regions where backscatter dynamics were most distinct. The consistent performance across most of the validation period demonstrates the robustness of the customized threshold functions in accommodating both the spatial variability of sensor geometry and the temporal evolution of agricultural practices.

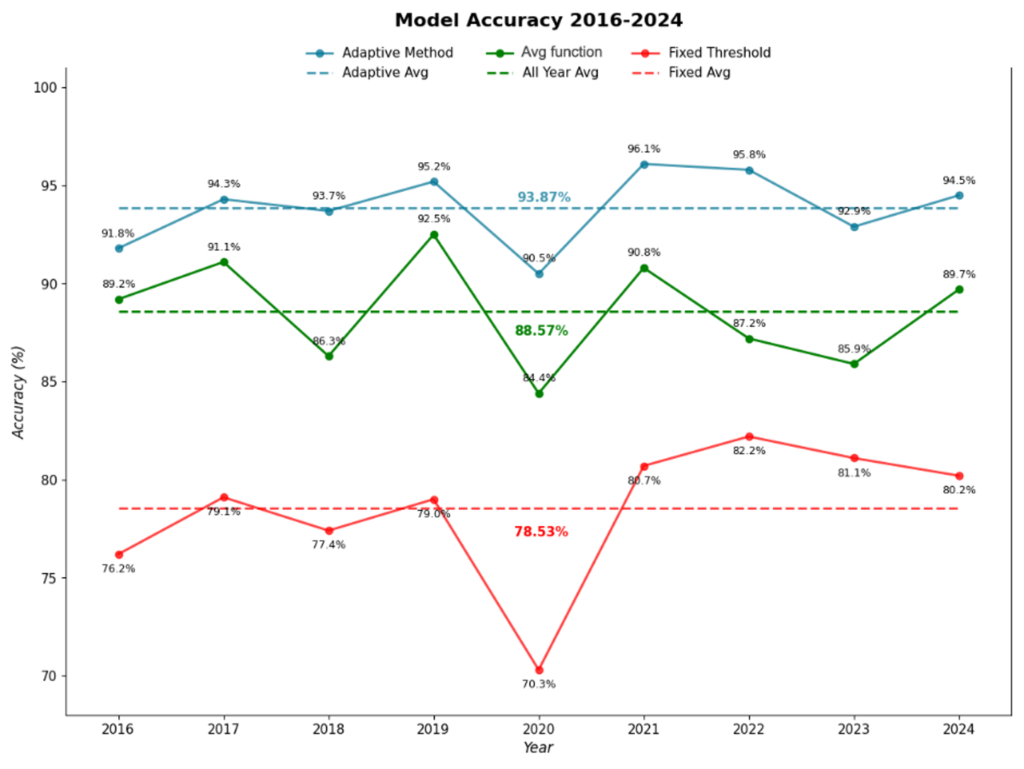
Fig. 15 Overall accuracy trends through the years when assessing the results with the validation samples: fixed thresholding (red line), adaptive thresholding by annual functions (blue line), adaptive thresholding by all years’ average function (green line), and average accuracies of each method in dashed lines
The comprehensive evaluation of the rice classification algorithm over nine years (2016-2024) by confusion matrix analysis exhibits robust performance, as shown in Fig. 16, with notable temporal variations linked to environmental and methodological factors. The overall categorization accuracy ranged from 90.5% to 96.1%, with a mean accuracy of 93.84%. The adaptive threshold approach effectively distinguished rice and non-rice pixels in the VMD.
The producer’s accuracy for rice classification, indicating the algorithm’s sensitivity in identifying actual rice pixels, was continuously high, with a mean of 94.76% and a range of 91.00% to 97.00%. This figure indicates the model’s efficacy in minimizing omission mistakes, which occur when actual rice areas are misclassified as non-rice. The producer’s accuracy for non-rice areas (specificity) exhibited some variability, averaging 92.47%, ranging from 87.00% to 95.25%. This indicates that distinguishing between agricultural and non-agricultural areas was occasionally challenging.
The accuracy metrics for users, indicating the reliability of positive classifications, performed exceptionally, with an average precision of 94.98% for rice users, ranging from 91.64% to 96.81%. The approach effectively minimized commission mistakes, wherein non-rice pixels could be inaccurately labeled as rice. The accuracy of non-rice users averaged 92.18%, ranging from 86.92% to 95.47%. The temporal study indicates that 2021 achieved the best overall accuracy at 96.1%. This occurred due to sustained La Niña conditions, which led to more consistent agricultural practices and reduced environmental pressures. Conversely, 2020 exhibited the lowest accuracy at 90.5%. This resulted from challenging environmental conditions, such as drought stress and alterations to irrigation schedules that modified the typical backscatter characteristics. This temporal variability underscores the algorithm’s sensitivity to climate-induced changes in rice cultivation patterns. It confirms the necessity for annual threshold function calibration to adjust to evolving agricultural practices driven by environmental stressors such as El Niño events.

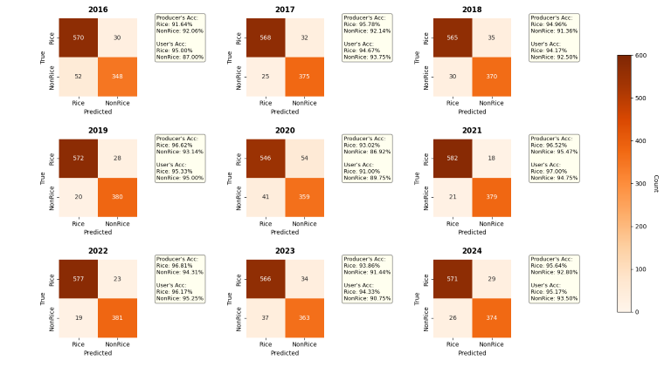
Fig. 16 Confusion matrices for the customised thresholding functions by year, with the respective producers’ and users’ accuracies
5.2.2 Assessment versus statistical total rice area
Table 1 presents a comprehensive comparison of total rice planted areas across the VMD region from 2016 to 2023, measured in hectares. The values highlighted in yellow represent area calculations derived from the customized threshold functions developed for each respective year, while the official statistics from the General Statistics Office of Vietnam (GSO) provide the reference benchmark. The pink-highlighted cells indicate the years in which the model-derived estimates most closely matched the official statistics, demonstrating the temporal variability in model performance.
Table 1 Total rice planted areas (in thousands ha) by year, computed from their respective functions (yellow highlighted) compared with official statistics by GSO. Pink-highlighted cells indicate the figures closest to the respective year’s statistics.

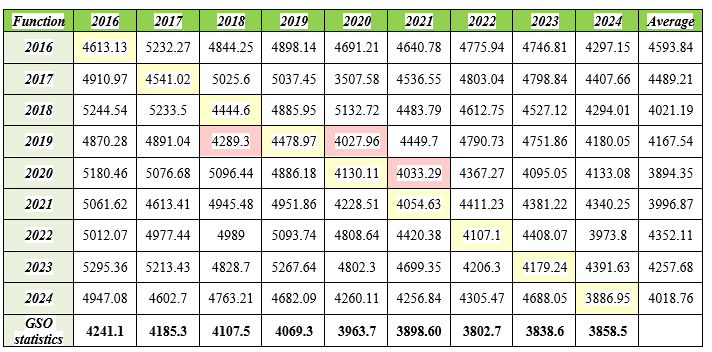
This comparative analysis reveals the effectiveness of the incidence “angle-dependent” threshold approach, with accuracy levels ranging from approximately 88% in extreme ENSO years to over 94% during stable environmental conditions. The table further highlights the challenges in accurate area estimation during years of significant environmental stress, particularly in 2016 (strong El Niño) and 2023 (renewed El Niño conditions), where greater discrepancies are observed between estimated and official figures.

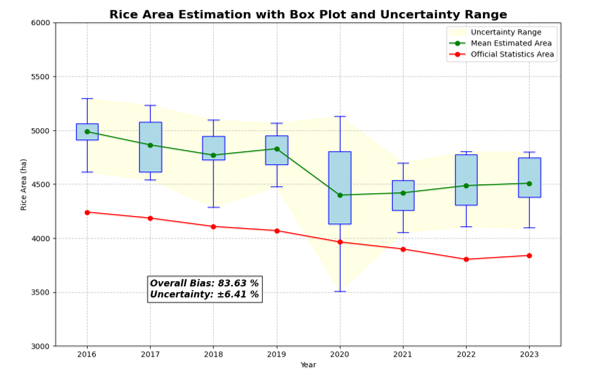
Fig. 17 Comparison of the total rice area between each year’s estimation and the official statistics. The box plot shows the uncertainty ranges of estimations when applying the function of a certain year to others.
As seen on Fig. 17, the mean estimated rice planted areas (in green line) are consistently higher than the official statistics areas around 5-16% for every year during 2016-2023. However, most rice fields in the VMD are owned and managed by household farmers, who usually plan their own agricultural practices, meaning that the farmers might not always report accurately to the government. This makes the figures for total rice planted in reality higher than the statistics, hence closer to our estimations.
Among all 13 provinces of the delta, Long An and An Giang witnessed the highest overestimations in rice planted areas throughout the study period, with errors averaging above 15% (Fig. 18). This may be due to the confusion between double-crop and triple-crop pixels, where every triple-crop pixel contributes to the total rice area of 100 m², compared to double-crop pixels. In contrast, the annual rice areas were always underestimated in Ben Tre for every year, with errors usually below -10% (Fig. 18), which could be due to the loss of rice pixels being defined as non-rice near the coastal region.

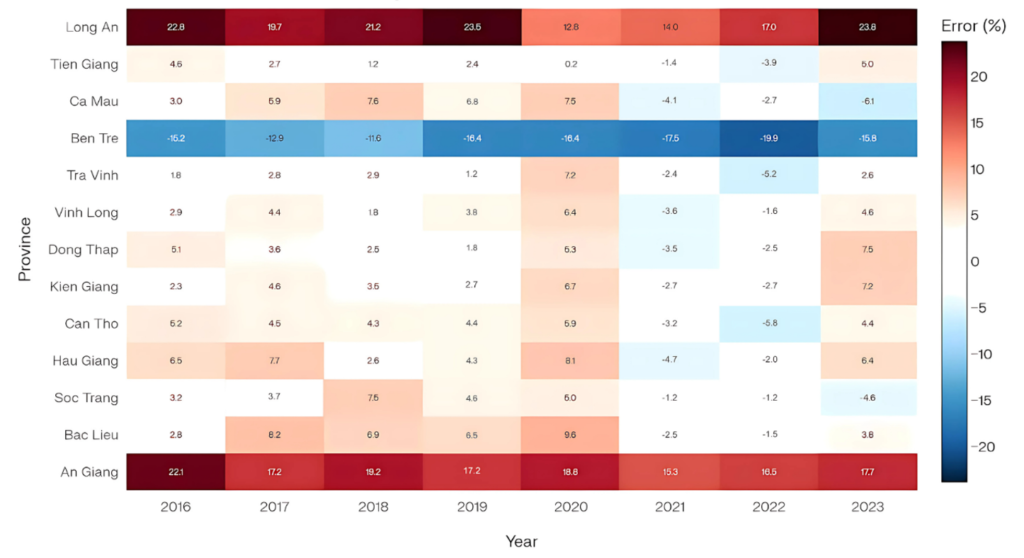
Fig. 18 Rice planted area errors (in ha) by provinces in comparison with official statistics during 2016-2024
5.3. Annual crop intensity maps
Fig. 19 depicts the annual rice crop intensity maps from 2016 to 2024, revealing pronounced regional variations and temporal shifts in cultivation patterns across the VMD. The color coding distinguishes between single-cropping (red), double-cropping (green), and triple-cropping (blue) systems. These spatial patterns clearly illustrate the gradient of vulnerability from the upper to the lower delta, with coastal regions showing earlier and more pronounced adaptation responses to environmental stressors.
- Upper Delta Region (An Giang, Dong Thap)
– Maintained relatively stable triple-cropping systems (blue areas) from 2016 to 2020.
– A slight reduction in triple-cropping areas was observed from 2021-2023, with some regions shifting to double-cropping (green areas)
– The transition appears most pronounced in peripheral areas, while core agricultural zones retained intensive cultivation patterns
- Middle Delta Region (Can Tho, Vinh Long)
– Predominantly double-cropping systems (green areas) with scattered triple-cropping zones
– Gradual decrease in triple-cropping areas from 2019 onwards
– More dynamic shifts between single and double cropping patterns, particularly evident in 2020-2022 during La Niña conditions
- Coastal Provinces (Bac Lieu, Soc Trang, Tra Vinh)
– Most dramatic changes observed in cropping intensity
– Progressive reduction in double-cropping areas from 2016 to 2023
– Clear trend of agricultural adaptation with some areas transitioning to rice-aquaculture systems
- Peninsula Region (Ca Mau, Kien Giang)
– Historically dominated by single and double-cropping patterns
– Notable decrease in cultivated area from 2020-2023
– Substantial increase in non-rice areas, particularly in coastal zones
– Most vulnerable to saltwater intrusion, showing the earliest signs of cultivation pattern changes
The temporal evolution shows a general trend toward reduced cropping intensity, particularly in coastal areas, reflecting the combined impacts of environmental stressors and adaptation strategies. This pattern is most pronounced in the transition from 2020 to 2023, coinciding with the shift from La Niña to El Niño conditions.

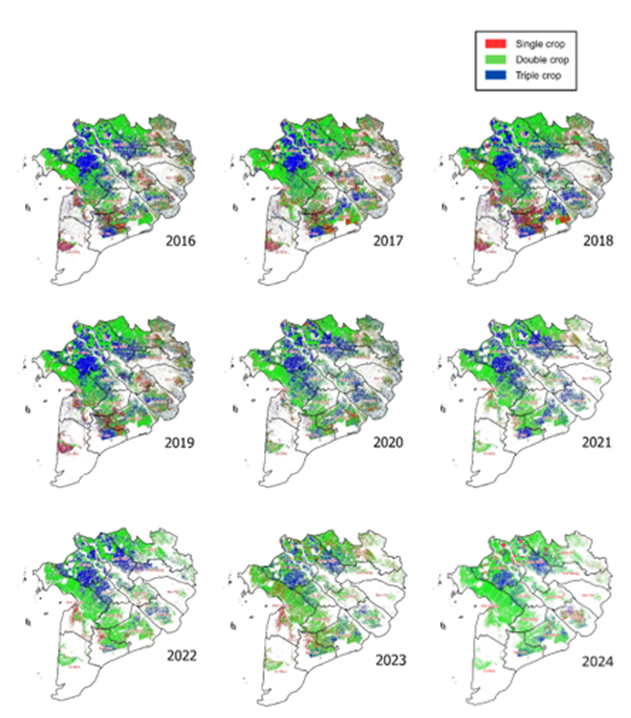
Fig. 19 The annual crop intensity maps through the years (2016-2024)
5.4. Sowing dates estimations
Fig. 20 presents probability density function (PDF) curves showing the distribution of sowing dates for the three main rice seasons—Winter-Spring (WS), Summer-Autumn (SA), and Autumn-Winter (AW)—across the VMD from 2016 to 2024. The curves reveal distinct temporal shifts in sowing patterns corresponding to ENSO phase transitions.
During the El Niño periods of 2019-2020 and 2023-2024, the Winter-Spring crop showed an earlier sowing peak by approximately 15-30 days compared to standard years, reflecting farmers’ adaptation strategy to avoid peak salinity periods by using Climate-Smart Map and Adaptation Plan (CS-MAP) (CCAFS SEA et al., 2020; CGIAR Research Program on Climate Change, Agriculture and Food Security et al., 2020; IRRI, 2023). These adjustments were made after learning from the massive agricultural losses in 2016 (221,000 ha of rice, 6,500 ha of vegetables, and 26,500 ha of fruits, equivalent to $210 million) due to the worst drought and salinity in history (PV Group, 2016; Wikipedia, 2016; VnExpress, 2016).
The Summer-Autumn distributions show greater variability during La Niña years (2017-2018), with broader, more dispersed curves indicating less synchronized planting across the region.

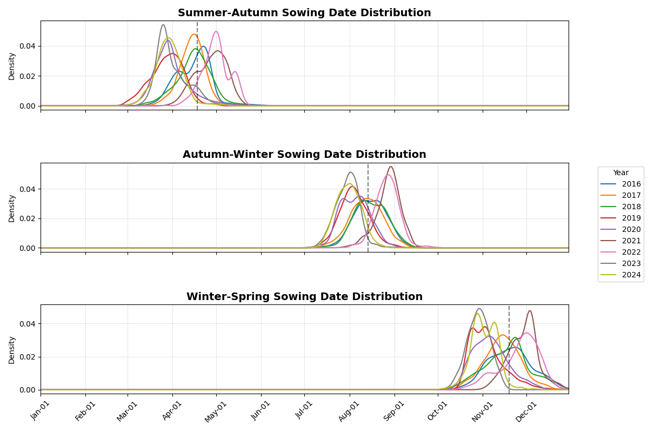
Fig. 20 The PDF curves show the distributions of sowing dates for each main season (WS, SA & AW) for each year from 2016 to 2024
The Autumn-Winter distributions show the most visible year-to-year variations, with some regions completely skipping this season during strong El Niño years, resulting in bimodal or attenuated distribution curves. These temporal shifts highlight farmers’ flexibility in adjusting planting calendars in response to changing environmental conditions, with sowing decisions increasingly driven by climate forecasts rather than traditional agricultural calendars.
Moreover, the estimated sowing time average deviations compared to each season’s reference baseline date (Fig. 21) highlight that:
- The Winter-Spring rice season (normally December to February) faces the most severe climate-related disruptions and consequently requires the most calendar adjustments, especially in coastal provinces, while the upper delta experiences the least impact by salt intrusion, thanks to its good dyke systems; hence, only a few days of adjustment were applied.
- The Summer-Autumn season (April to July) requires fewer calendar adjustments, as it coincides with the rainy season when salinity intrusion is naturally reduced and freshwater flow increases, resulting in early sowing only 5-10 days compared to the standard time.
- El Niño phases in 2019-2020 and 2023-2024 observed the early planting following CS-MAP to avoid salt intrusion & drought after the significant damage in 2016 (PV Group, 2016; Wikipedia, 2016; VnExpress, 2016)
- La Niña phases have a more substantial effect on the Autumn-Winter season compared to the others, since their time collides with the rainy season, leading to a higher risk of flooding and subsidence. Therefore, only some provinces with good dyke systems plant this season.
Furthermore, there are clearly visible spatial patterns that coincide with the borders of the provinces, proving 1) the accuracy of the method, 2) the political/administrative/logistical component of the strategies of adaptation.

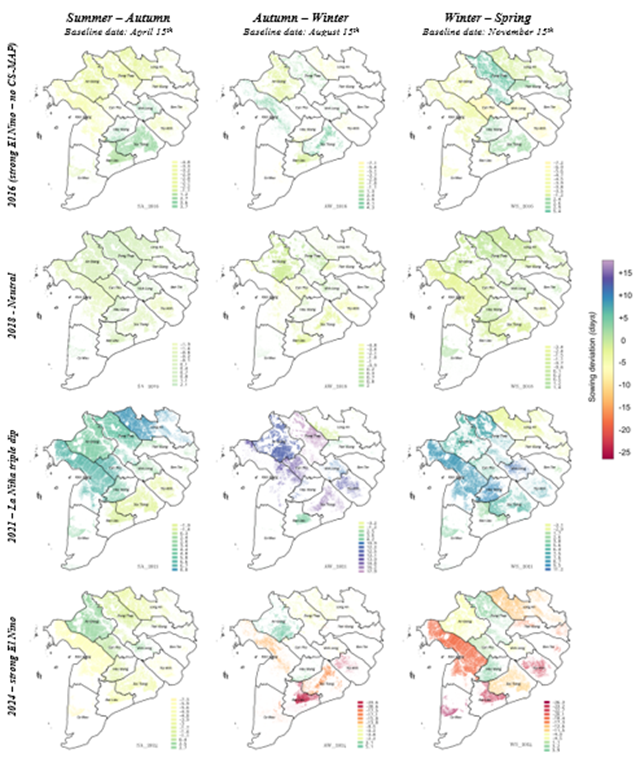
Fig. 21. Average seasonal sowing dates deviations in years, corresponding to intense El Niño/ La Niña phases before and after applying CS-MAP
6. Discussion
The VH polarization alone demonstrates superior sensitivity to rice canopy structure and biomass accumulation. VH backscatter exhibits distinct temporal patterns during rice growth stages, particularly during the vegetative phase when volume scattering from the developing canopy becomes dominant.
During the initial flooding stage, specular reflection from standing water results in low backscatter values (VH: −25 to −20 dB), forming distinct local minima in the backscatter time series (Duy Ba et al., 2015; Waldini et al., 2021). As rice plants enter the vegetative phase (tillering and stem elongation), volume scattering from emerging vegetation increases backscatter by 6–10 dB, reaching peak values (VH: −15 to −12 dB) coinciding with the heading stage(Wang et al., 2015; Phan et al., 2018). This peak corresponds to maximum canopy density and vertical plant structure, creating a pronounced local maximum. Post-heading, backscatter declines gradually (2–4 dB) during grain filling and maturation as leaves senesce and fields drain (Phan, 2018).
The temporal analysis of rice crop intensity maps from 2016 to 2024 reveals significant shifts in cultivation patterns across the VMD, which are strongly influenced by climate variability and environmental stressors. The 2015-2016 period marked a notable decline in rice cultivation intensity, particularly evident in the coastal provinces, where many regions shifted from double or triple cropping to single cropping patterns. This reduction was primarily attributed to the severe El Niño event (Fig. A2), which caused unprecedented saline intrusion affecting approximately 450,000- 650,000 ha of cropland (Eslami et al., 2021).
Between 2017 and 2019, the delta experienced relatively stable cultivation patterns under moderate to weak La Niña conditions. The upper delta provinces maintained predominantly double and triple cropping systems, while some coastal regions successfully implemented triple cropping, indicating temporary relief from salinity pressures (Ngo T. H. Yen and Le T. Nguyet, 2025). This period of stability was characterized by more predictable rainfall patterns and manageable salinity levels, enabling farmers to maintain traditional cultivation intensities.
A significant transformation occurred from mid-2020 to 2022, coinciding with the “triple-dip” La Niña phenomenon. The increased rainfall during this period facilitated the expansion of triple-cropping systems in several regions, particularly in the upper and middle delta (Ngo T. H. Yen and Le T. Nguyet, 2025). However, this intensification was not uniform across the delta, as some coastal areas continued to face challenges from progressive salt intrusion, which has been advancing at a rate of 0.2 to 0.5 PSU per year. The combination of increased tidal amplitude (2 cm/year) and bed level incision (2-3 meters) has exacerbated these challenges, particularly in the lower delta regions (Eslami et al., 2019).
The most recent period (2023-2024) shows a marked shift in cultivation patterns, with many regions reverting to lower cropping intensities or alternative agricultural practices. This change coincides with another intense El Niño phase and reflects both immediate climate impacts and longer-term adaptive strategies. Notably, some areas have transitioned to rice-shrimp rotation systems or completely abandoned rice cultivation, particularly in coastal provinces where salinity intrusion has become a persistent challenge (World Bank Group, 2024). This transformation aligns with government initiatives to take approximately 250,000 ha of land out of rice production in the most vulnerable areas (Sengupta, 2023).
The spatial distribution of these changes reveals a clear gradient from the upper to the lower delta. Upper delta provinces have generally maintained higher cropping intensities due to better freshwater availability and lower risks of salinity. In contrast, coastal provinces show more dynamic changes in cropping patterns, reflecting their greater vulnerability to environmental stressors (Toan et al., 2021). This spatial variability is further complicated by the cumulative effects of upstream dam construction, which have significantly altered the delta’s hydrology and sediment transport patterns (Eslami et al., 2021).
The observed changes in crop intensity patterns also reflect broader agricultural adaptation strategies. Farmers have increasingly adopted flexible cropping calendars, often adjusting sowing dates by 20-24 days in response to ENSO events (Ngo T. H. Yen and Le T. Nguyet, 2025). In some areas, particularly during El Niño years, farmers have entirely skipped the autumn-winter crop to minimize risks, leading to reduced annual cropping intensity (Eslami et al., 2019). These adaptations represent a significant shift from the traditional agricultural calendar, demonstrating the farming community’s response to changing environmental conditions.
The temporal evolution of cropping intensity also reveals the compound effects of multiple stressors. While ENSO events drive short-term variations, longer-term trends such as sea-level rise, land subsidence, and reduced sediment flow due to upstream dams create persistent challenges for maintaining high cropping intensities (Eslami et al., 2019). The combination of these factors has led to projections of potential rice production decreases of up to 2.13 million tons under moderate climate scenarios and 2.5 million tons under more severe scenarios by 2050 (Yen et al., 2019).
Recently, the “1 Million Hectares of High-Quality Rice” program in Vietnam (IRRI, 2024; CGIAR Initiative on Asian Mega-Deltas, 2024) encourages low-emission practices such as alternate wetting and drying (AWD) and organic amendments to fight soil degradation. SAR-based methane models, leveraging the synergy of L-band (ALOS2-PALSAR) and C-band, have quantified emission reductions of 20–30% under AWD.
Regarding the shifts in rice sowing time, Fig. 20 and Fig. 21 demonstrate clear trends of early sowing during El Niño (2019-2020, 2023-2024) and delayed sowing in La Niña years (2021-2022) after a significant loss in 2016 due to deep salt intrusions and droughts under the severe El Niño 2016 phase. Thus, to prepare for the worst seawater intrusion of the past century in 2019, the Ministry of Agriculture advised farmers to implement the CS-MAP, which recommended early sowing around 15-30 days for the Winter-Spring crop and 5-10 days for the Summer-Autumn crop. This approach proved effective then and was applied again in 2023-2024. The coastal regions (such as Ben Tre, Bac Lieu, Soc Trang, Tra Vinh, Ca Mau) and estuarine provinces (Kien Giang, Tien Giang, Long An) are the primary targets of these calendar adjustments when there are forecasts of brutal salt intrusion.
On the contrary, La Niña brings unpredictable rainfall and flooding, forcing farmers to delay sowing, especially in some upper areas, where irrigation and dike infrastructures are weak (i.e., Long An, Hau Giang), as prolonged floods prevent soil preparation for rice planting. The “triple-dip” in late 2020-2022 was abnormally long, which contributed to several natural disasters, spreading not only floods but also harmful pests. It caused a delay of about 10-20 days for Autumn-Winter in 2021-2022, and 5-10 days for the next Winter-Spring. Hence, only the high-dyke provinces (i.e., An Giang, Dong Thap, Can Tho) kept planting the Autumn-Winter crop.
7. Conclusions
This study presents a practical and interpretable approach for extensive monitoring of rice agriculture in the VMD using multi-temporal Sentinel-1 SAR data. Our method addresses significant obstacles presented by varied agro-ecosystems and fluctuating sensor geometries by incorporating adaptive temporal smoothing of the VH/VV ratio for automatic seasonal detection, together with incidence “angle-dependent” VH backscatter thresholds.
VH backscatter profiles are used for definitive rice detection after using the VH/VV ratio time series to identify potential growing seasons and their temporal windows. This dual-step approach leverages:
- VH’s robust correlation with rice biomass development
- Greater dynamic range in VH backscatter between flooding and peak vegetative stages
- More consistent temporal signatures across different rice varieties compared to VV polarization
During the growing season, the maximum increase in VH backscatter (VHmax_increase) serves as the primary metric for rice classification, capturing the characteristic transition from water-dominated to vegetation-dominated scattering mechanisms.
While computationally efficient, fixed threshold methods fail to account for Sentinel-1’s wide incidence angle range (31°–46° across the VMD), which induces systematic backscatter variations. At near-range (31°), double-bounce interactions between vertical rice stems and water amplify VH backscatter by 1.2–1.8 dB compared to far-range (46°) acquisitions (K. Clauss et al., 2018; Phan et al., 2018). Consequently, a universal threshold (e.g., VH ≥ −18 dB) misclassifies 22–35% of rice pixels in high-incidence zones as non-rice while overestimating rice extent in low-incidence regions by 18% (Phan, 2018).
The customized threshold function approach developed in this study strategically bridges these methodologies by incorporating the adaptability of machine learning with the computational efficiency and physical interpretability of threshold techniques. By deriving polynomial functions that dynamically adjust detection parameters based on incidence angle and temporal context, the method achieves robust performance across the VMD’s heterogeneous landscape without requiring extensive training datasets (Tian et al., 2023). This approach particularly excels in regions like the VMD, where varying incidence angles significantly impact backscatter values, and agricultural practices exhibit substantial spatial and temporal variability. Integrating pixel-based temporal analysis with spatially adaptive thresholds enables precise delineation of rice fields while maintaining the operational efficiency necessary for large-scale monitoring applications (Yang et al., 2021).
Thorough ground samples confirm that classification accuracies are over 90% for nine years, and the estimated total planted areas match official numbers closely, showing that this is useful for monitoring operations. The study shows that different regions have varied farming practices: the upper delta provinces continued to grow three crops a year, while coastal areas saw a slow decrease in how much they farmed and started using different methods like rice-aquaculture rotations. Additionally, sowing date assessments indicate considerable adaptive changes in planting timelines, especially during El Niño and La Niña events. The results illustrate the method’s ability to assist government agencies, agribusinesses, and researchers by providing timely, high-resolution rice maps and phenological indicators. Future efforts could improve this method by adding more types of SAR polarizations, combining optical data when the sky is clear, and using it in real-time to help manage water and climate policies in areas that rely on rice farming.
Authors contribution
Data curation: Thao Nguyen-Thi
Methodology: Thao Nguyen-Thi, Alexandre Bouvet, Lionel Jarlan
Supervision: Alexandre Bouvet, Lionel Jarlan
Validation: Thao Nguyen-Thi, Alexandre Bouvet, Lionel Jarlan
Visualization: Thao Nguyen-Thi
Writing – original draft: Thao Nguyen-Thi
Writing – review & editing: Alexandre Bouvet, Lionel Jarlan, Thuy Le Toan, Stéphane Mermoz, Juan Doblas
Declaration of competing interest
The authors declare that they have no known competing financial interests or personal relationships that could have appeared to influence the work reported in this paper.
Acknowledgements
The authors gratefully acknowledge the French Centre National d’Etudes Spatiales (CNES) for providing dedicated high-performance computing resources on the TREX cluster. The authors also thank the Vietnam National Space Center (VNSC), the University of Bac Lieu, and the University of An Giang, who carried out the ground data collection campaigns.
Funding
This work was supported by the Institut de Recherche pour le Développement (IRD) through a PhD fellowship awarded to Thao Nguyen-Thi at the University of Toulouse. The field trips of Thao Nguyen-Thi were supported by the Toulouse Graduate School of Earth and Space Science (TESS). The ground data collection was funded by CNES through the MERIMEE Space Climate Observatory project. Part of this work was funded by the European Commission through the Development Smart Innovation through Research in Agriculture (DeSIRA) initiative, within the STAR-FARM project.
References
Aalst, M. A. van, E. Koomen, and H. L. F. de Groot. 2023. “Vulnerability and Resilience to Drought and Saltwater Intrusion of Rice Farming Households in the Mekong Delta, Vietnam.” Economics of Disasters and Climate Change 7 (3): 407–30. https://doi.org/10.1007/s41885-023-00133-1.
Alexandre, Cyprien, Rosa Johary, Thibault Catry, et al. 2020. “A Sentinel-1 Based Processing Chain for Detection of Cyclonic Flood Impacts.” Remote Sensing 12 (2): 252. https://doi.org/10.3390/rs12020252.
Arellano, C. M., A. A. Maralit, E. C. Paringit, et al. 2019. “MULTI-TEMPORAL ANALYSIS OF DENSE AND SPARSE FORESTS’ RADAR BACKSCATTER USING SENTINEL-1A COLLECTION IN GOOGLE EARTH ENGINE.” The International Archives of the Photogrammetry, Remote Sensing and Spatial Information Sciences XLII-4-W19 (December): 23–30. https://doi.org/10.5194/isprs-archives-XLII-4-W19-23-2019.
Bazzi, Hassan, Nicolas Baghdadi, Mohammad El Hajj, et al. 2019. “Mapping Paddy Rice Using Sentinel-1 SAR Time Series in Camargue, France.” Remote Sensing (Basel, Switzerland) 11 (7). https://doi.org/10.3390/rs11070887.
Bouvet, Alexandre, and Thuy Le Toan. 2011. “Use of ENVISAT/ASAR Wide-Swath Data for Timely Rice Fields Mapping in the Mekong River Delta.” Remote Sensing of Environment 115 (4): 1090–101. https://doi.org/10.1016/j.rse.2010.12.014.
Bouvet, Alexandre, Thuy Le Toan, Nicolas Floury, and Trevor Macklin. 2010. “An End-to-End Error Model for Classification Methods Based on Temporal Change or Polarization Ratio of SAR Intensities.” IEEE Transactions on Geoscience and Remote Sensing 48 (9): 3521–38. https://doi.org/10.1109/TGRS.2010.2047399.
Bouvet, Alexandre, Thuy Le Toan, and Nguyen Lam-Dao. 2009. “Monitoring of the Rice Cropping System in the Mekong Delta Using ENVISAT/ASAR Dual Polarization Data.” IEEE Transactions on Geoscience and Remote Sensing 47 (2): 517–26. https://doi.org/10.1109/TGRS.2008.2007963.
Bui Tan Yen, Nguyen Hong Son, and Le Thanh Tung. 2019. “Climate Risk Mapping Provides Rice Growers with Adaptation Options in the Mekong River Delta.” Research Outreach, December 5. https://researchoutreach.org/articles/climate-risk-mapping-adaptation-mekong-river-delta/.
CCAFS SEA, DCP-MARD, Alliance of Bioversity and CIAT, IWRP, CGIAR Research Program on Climate Change, and Agriculture and Food Security. 2020. “Climate-Smart Mapping and Adaptation Planning (CS-MAP) of Four Provinces in Vietnam’s South Central Coast.” CCAFS (Hanoi, Vietnam). https://alliancebioversityciat.org/publications-data/climate-smart-mapping-and-adaptation-planning-cs-map-four-provinces-vietnams.
CGIAR Initiative on Asian Mega-Deltas. 2024. “Vietnam Launches the One Million Hectares Program Specializing in High-Quality Low-Emission Rice Production.” CGIAR, November 1. https://www.cgiar.org/news-events/news/vietnam-launches-the-one-million-hectares-program-specializing-in-high-quality-low-emission-rice-production/.
CGIAR Research Program on Climate Change, Agriculture and Food Security, Alliance of Bioversity International and CIAT, Department of Crop Production, and Institute of Water Resources Planning. 2020. “Climate-Smart Mapping and Adaptation Planning (CS-MAP) of 12 provinces in Vietnam’s Red River Delta and Northern Midlands.” CCAFS, December 21. https://ccafs.cgiar.org/fr/resources/publications/climate-smart-mapping-and-adaptation-planning-cs-map-12-provinces.
Chi Linh. 2022. “Salinity intrusion in the dry season in 2021-2022 is higher than the average for many years (in Vietnamese).” Vietnam People’s Public Security Newspaper – CAND (Báo Công an Nhân dân), November 2. https://cand.com.vn/doi-song/xam-nhap-man-mua-kho-nam-2021-2022-o-muc-cao-hon-trung-binh-nhieu-nam-i643769/.
Clauss, K., M. Ottinger, and C. Kuenzer. 2018. “Mapping Rice Areas with Sentinel-1 Time Series and Superpixel Segmentation.” International Journal of Remote Sensing 39 (5): 1399–420. https://doi.org/10.1080/01431161.2017.1404162.
Clauss, Kersten, Marco Ottinger, Patrick Leinenkugel, and Claudia Kuenzer. 2018. “Estimating Rice Production in the Mekong Delta, Vietnam, Utilizing Time Series of Sentinel-1 SAR Data.” International Journal of Applied Earth Observation and Geoinformation 73 (December): 574–85. https://doi.org/10.1016/j.jag.2018.07.022.
Duy Ba, Nguyen, Kersten Clauss, Senmao Cao, Vahid Naeimi, Claudia Kuenzer, and Wolfgang Wagner. 2015. “Mapping Rice Seasonality in the Mekong Delta with Multi-Year Envisat ASAR WSM Data.” Remote Sensing 7 (12): 12. https://doi.org/10.3390/rs71215808.
Duy Ba, Nguyen, Alexander Gruber, and Wolfgang Wagner. 2016. “Mapping Rice Extent and Cropping Scheme in the Mekong Delta Using Sentinel-1A Data.” Remote Sensing Letters 7 (12): 1209–18. https://doi.org/10.1080/2150704X.2016.1225172.
Earth Science Data Systems and NASA. 2025. “NASA Shuttle Radar Topography Mission Global 1 Arc Second V003 | NASA Earthdata.” Earth Science Data Systems, NASA, June 16. https://www.earthdata.nasa.gov/data/catalog/lpcloud-srtmgl1-003.
Escobar-Ruiz, Veronica, William Maslanka, Chris D. Westbrook, et al. 2024. “A Radar Backscatter Simulation of a Forest Canopy Using 3D Physical Structures Derived from LiDAR Scanning.” International Journal of Remote Sensing 45 (22): 8594–621. https://doi.org/10.1080/01431161.2024.2403626.
Eslami, Sepehr, Piet Hoekstra, Herman W. J. Kernkamp, et al. 2021. “Dynamics of Salt Intrusion in the Mekong Delta: Results of Field Observations and Integrated Coastal–Inland Modelling.” Earth Surface Dynamics 9 (4): 953–76. https://doi.org/10.5194/esurf-9-953-2021.
Eslami, Sepehr, Piet Hoekstra, Nam Nguyen Trung, et al. 2019. “Tidal Amplification and Salt Intrusion in the Mekong Delta Driven by Anthropogenic Sediment Starvation.” Scientific Reports 9 (1): 18746. https://doi.org/10.1038/s41598-019-55018-9.
Google. n.d. “Google Earth Pro.” https://www.google.com/earth/.
Hung Vo. 2022. “Mekong Delta: Salinity intrusion in the dry season in 2022 is high (in Vietnamese).” Xã Hội,Môi Trường. Vietnam+ (VietnamPlus), February 17. https://www.vietnamplus.vn/dong-bang-song-cuu-long-xam-nhap-man-mua-kho-nam-2022-o-muc-cao-post773457.vnp.
IRRI. 2023. “Introducing Climate-Smart Mapping and Adaptation Planning in Cambodia.” International Rice Research Institute – IRRI, January 9. https://www.irri.org/news-and-events/news/introducing-climate-smart-mapping-and-adaptation-planning-cambodia.
IRRI. 2024. “Vietnam’s 1-Million Hectare Rice Program Shows Promising Results.” International Rice Research Institute, September 16. https://www.irri.org/news-and-events/news/vietnam%E2%80%99s-1-million-hectare-rice-program-shows-promising-results.
Jiang, Qin, Zhiguang Tang, Linghua Zhou, et al. 2023. “Mapping Paddy Rice Planting Area in Dongting Lake Area Combining Time Series Sentinel-1 and Sentinel-2 Images.” Remote Sensing 15 (11): 11. https://doi.org/10.3390/rs15112794.
Kaplan, Gregoriy, Lior Fine, Victor Lukyanov, V. S. Manivasagam, Josef Tanny, and Offer Rozenstein. 2021. “Normalizing the Local Incidence Angle in Sentinel-1 Imagery to Improve Leaf Area Index, Vegetation Height, and Crop Coefficient Estimations.” Land 10 (7): 680. https://doi.org/10.3390/land10070680.
K.Linh. 2025. “Promoting Low-Emission Rice Farming Model in the Mekong Delta.” Ministry of Agriculture and Environment of Vietnam, September 4. https://en.mae.gov.vn:443/Pages/chi-tiet-tin-Eng.aspx?ItemID=8801.
Kumar, Vineet, Manuel Huber, Björn Rommen, and Susan C. Steele-Dunne. 2022. “Agricultural SandboxNL: A National-Scale Database of Parcel-Level Processed Sentinel-1 SAR Data.” Scientific Data 9 (1): 402. https://doi.org/10.1038/s41597-022-01474-4.
Le Viet Phu and Do Truong Phuong Lam. 2023. “Rice, Irrigation Policy and the Need for Improved Water Management in Vietnam.” Global Water Forum, September 19. https://www.globalwaterforum.org/2023/09/19/rice-irrigation-policy-and-the-need-for-improved-water-management-in-vietnam/.
Leon Ai and Izumi Taro. 2022. “Impacts of Alternate Wetting and Drying on Rice Farmers’ Profits and Life Cycle Greenhouse Gas Emissions in An Giang Province in Vietnam.” Journal of Cleaner Production 354 (June): 131621. https://doi.org/10.1016/j.jclepro.2022.131621.
Ma, Hao, Lihua Wang, Weiwei Sun, et al. 2023. “A New Rice Identification Algorithm under Complex Terrain Combining Multi-Characteristic Parameters and Homogeneous Objects Based on Time Series Dual-Polarization Synthetic Aperture Radar.” Frontiers in Ecology and Evolution 11. https://www.frontiersin.org/articles/10.3389/fevo.2023.1093454.
Minderhoud, P. S. J., L. Coumou, G. Erkens, H. Middelkoop, and E. Stouthamer. 2019. “Mekong Delta Much Lower than Previously Assumed in Sea-Level Rise Impact Assessments.” Nature Communications 10 (August): 3847. https://doi.org/10.1038/s41467-019-11602-1.
Minh Dam, Huu Duc, and Hien Anh. 2021. “Alternating Wetting and Drying (AWD) Helps Mekong Delta Rice Farmers Cope with Droughts.” News. Vietnam Agriculture and Environment Newspaper, December 1. https://van.nongnghiepmoitruong.vn/alternating-wetting-and-drying-awd-helps-mekong-delta-rice-farmers-cope-with-droughts-d309289.html.
Ngo T. H. Yen and Le T. Nguyet. 2025. “Climate Variability Induced the Impact of El-Niño Southern Oscillation Events on Rice-Growing Areas in the Mekong Delta Region.” Revista Brasileira de Engenharia Agrícola e Ambiental 29 (5): e288921. https://doi.org/10.1590/1807-1929/agriambi.v29n5e288921.
Nguyen Lam Dao, Thuy Le Toan, and Nicolas Floury. 2009. “The Use of SAR Data for Rice Crop Monitoring A Case Study of Mekong River Delta–Vietnam.” ResearchGate, January. https://www.researchgate.net/publication/228762447_The_Use_of_SAR_Data_for_Rice_Crop_Monitoring_A_Case_Study_of_Mekong_River_Delta-Vietnam.
Nguyen, Thi Thu Ha, C. A. J. M. de Bie, A. Ali, E. M. A. Smaling, and C. T. Hoanh. 2012. “Mapping the Irrigated Rice Cropping Patterns of the Mekong Delta, Vietnam through Hyper-Temporal SPOT NDVI Image Analysis.” International Journal of Remote Sensing 33 (2): 415–34. https://doi.org/10.1080/01431161.2010.532826.
Nguyen, Van-Hung, Alexander M. Stuart, Thi-My-Phung Nguyen, et al. 2022. “An Assessment of Irrigated Rice Cultivation with Different Crop Establishment Practices in Vietnam.” Scientific Reports 12 (1): 401. https://doi.org/10.1038/s41598-021-04362-w.
Ochieng, Peter Juma, Zoltán Maróti, József Dombi, Miklós Krész, József Békési, and Tibor Kalmár. 2023. “Adaptive Savitzky–Golay Filters for Analysis of Copy Number Variation Peaks from Whole-Exome Sequencing Data.” Information 14 (2): 2. https://doi.org/10.3390/info14020128.
Ogawa, Satoshi, Kyosuke Yamamoto, Kenichi Uno, Nguyen Cong Thuan, Takashi Togami, and Soji Shindo. 2022. “Optimal Water Level Management for Mitigating GHG Emissions through Water-Conserving Irrigation in An Giang Province, Vietnam.” Sensors (Basel, Switzerland) 22 (21): 8418. https://doi.org/10.3390/s22218418.
Onojeghuo, Alex O., George A. Blackburn, Qunming Wang, Peter M. Atkinson, Daniel Kindred, and Yuxin Miao. 2018. “Mapping Paddy Rice Fields by Applying Machine Learning Algorithms to Multi-Temporal Sentinel-1A and Landsat Data.” International Journal of Remote Sensing 39 (4): 1042–67. https://doi.org/10.1080/01431161.2017.1395969.
Onojeghuo, Alex Okiemute, Yuxin Miao, and George Alan Blackburn. 2023. “Deep ResU-Net Convolutional Neural Networks Segmentation for Smallholder Paddy Rice Mapping Using Sentinel 1 SAR and Sentinel 2 Optical Imagery.” Remote Sensing 15 (6): 1517. https://doi.org/10.3390/rs15061517.
Phan, Hoa, Thuy Le Toan, and Alexandre Bouvet. 2021. “Understanding Dense Time Series of Sentinel-1 Backscatter from Rice Fields: Case Study in a Province of the Mekong Delta, Vietnam.” Remote Sensing 13 (5): 5. https://doi.org/10.3390/rs13050921.
Phan, Hoa, Thuy Le Toan, Alexandre Bouvet, Lam Dao Nguyen, Tien Pham Duy, and Mehrez Zribi. 2018. “Mapping of Rice Varieties and Sowing Date Using X-Band SAR Data.” Sensors (Basel, Switzerland) 18 (1): 316. https://doi.org/10.3390/s18010316.
Phan, Thi Hoa. 2018. “Suivi Des Surfaces Rizicoles Par Télédétection Radar.” These de doctorat, Toulouse 3. https://www.theses.fr/2018TOU30328.
Phi Phung, Hoang, Nguyen Lam, Thong Nguyen-Huy, Thuy Le Toan, and Armando Apan. 2020. “Monitoring Rice Growth Status in the Mekong Delta, Vietnam Using Multitemporal Sentinel-1 Data.” Journal of Applied Remote Sensing 14 (March): 1. https://doi.org/10.1117/1.JRS.14.014518.
PV Group. 2016. “Đồng bằng sông Cửu Long khô cằn trong hạn mặn trăm năm.” TUOI TRE ONLINE, March 21. https://tuoitre.vn/dong-bang-song-cuu-long-kho-can-trong-han-man-tram-nam-1068949.htm.
Quegan, S., and Jiong Jiong Yu. 2001. “Filtering of Multichannel SAR Images.” IEEE Transactions on Geoscience and Remote Sensing 39 (11): 2373–79. https://doi.org/10.1109/36.964973.
Quynh Chi. 2024. “The Scientist behind Rice Varieties Cultivated across over 40% of the Mekong Delta.” News. Vietnam Agriculture and Environment Newspaper, February 20. https://van.nongnghiepmoitruong.vn/the-scientist-behind-rice-varieties-cultivated-across-over-40-of-the-mekong-delta-d376707.html.
Rodríguez, Ernesto, Charles S. Morris, and J. Eric Belz. 2006. “A Global Assessment of the SRTM Performance.” Photogrammetric Engineering & Remote Sensing 72 (3): 249–60. https://doi.org/10.14358/PERS.72.3.249.
“S1 Applications.” n.d. https://sentiwiki.copernicus.eu/web/s1-applications.
“S1Tiling 1.0.0rc2 Documentation.” n.d. https://s1-tiling.pages.orfeo-toolbox.org/s1tiling/latest/.
Sengupta, Somini. 2023. “Rice. Half of Humanity Eats It. And Climate Change Is Wrecking It.” Climate. The New York Times, May 20. https://www.nytimes.com/interactive/2023/05/20/climate/rice-farming-climate-change.html.
“Sentinel-1 GRD.” n.d. https://docs.sentinel-hub.com/api/latest/data/sentinel-1-grd/.
Sheng, Rodney Tai-Chu, Yu-Hsiang Huang, Pin-Cheng Chan, Showkat Ahmad Bhat, Yi-Chien Wu, and Nen-Fu Huang. 2022. “Rice Growth Stage Classification via RF-Based Machine Learning and Image Processing.” Agriculture 12 (12): 12. https://doi.org/10.3390/agriculture12122137.
SNV Netherlands Development Organisation. n.d. “Transforming Rice Value Chain for Climate Resilient and Sustainable Development in the Mekong Delta.” https://www.snv.org/project/transforming-rice-value-chain-climate-resilient-and-sustainable-development-mekong-delta.
Sonal Gupta, Victoria Mann, JJ Mazzucotelli, Michelle Gomez, and Hafsa Maqsood. 2023. “Vietnamese Rice Farmers Go High-Tech to Anticipate a Low-Water Future.” Environmental News. Mongabay Environmental News, July 24. https://news.mongabay.com/2023/07/vietnamese-rice-farmers-go-high-tech-to-anticipate-a-low-water-future/.
Thorp, K.R., and D. Drajat. 2021. “Deep Machine Learning with Sentinel Satellite Data to Map Paddy Rice Production Stages across West Java, Indonesia.” Remote Sensing of Environment 265 (November): 112679. https://doi.org/10.1016/j.rse.2021.112679.
Tian, Guixiang, Heping Li, Qi Jiang, et al. 2023. “An Automatic Method for Rice Mapping Based on Phenological Features with Sentinel-1 Time-Series Images.” Remote Sensing 15 (11): 2785. https://doi.org/10.3390/rs15112785.
Toan, Thuy Le, Nguyen Huu, Michel Simioni, et al. 2021. Agriculture in Viet Nam under the Impact of Climate Change. November 1. https://hal.inrae.fr/hal-03456472.
Topouzelis, Konstantinos, Suman Singha, and Dimitra Kitsiou. 2016. “Incidence Angle Normalization of Wide Swath SAR Data for Oceanographic Applications.” Open Geosciences 8 (1): 450–64. https://doi.org/10.1515/geo-2016-0029.
Van Hung, Nguyen, Tran Ngoc Thach, Nguyen Ngoc Hoang, et al. 2024. “Mechanized Wet Direct Seeding for Increased Rice Production Efficiency and Reduced Carbon Footprint.” Precision Agriculture 25 (5): 2226–44. https://doi.org/10.1007/s11119-024-10163-8.
Veloso, Amanda, Stéphane Mermoz, Alexandre Bouvet, et al. 2017. “Understanding the Temporal Behavior of Crops Using Sentinel-1 and Sentinel-2-like Data for Agricultural Applications.” Remote Sensing of Environment 199 (September): 415–26. https://doi.org/10.1016/j.rse.2017.07.015.
VnExpress. 2016. “Saltwater Threatens to Drown Nearly Half of Vietnam’s Paddy Fields – VnExpress International.” VnExpress International – Latest News, Business, Travel and Analysis from Vietnam, July 12. https://e.vnexpress.net/news/news/saltwater-threatens-to-drown-nearly-half-of-vietnam-s-paddy-fields-3434969.html.
Waldini, Hafidh, Iqbal Putut Ash Shidiq, Rokhmatuloh Rokhmatuloh, and Supriatna Supriatna. 2021. “Rice Crop Phenology Model to Monitor Rice Planting and Harvesting Time Using Remote Sensing Approach.” E3S Web of Conferences 232: 03020. https://doi.org/10.1051/e3sconf/202123203020.
Wang, Jing, Jing-Feng Huang, Xiu-Zhen Wang, et al. 2015. “Estimation of Rice Phenology Date Using Integrated HJ-1 CCD and Landsat-8 OLI Vegetation Indices Time-Series Images.” Journal of Zhejiang University. Science. B 16 (10): 832–44. https://doi.org/10.1631/jzus.B1500087.
Wang, Mo, Jing Wang, Li Chen, and Zhigang Du. 2022. “Mapping Paddy Rice and Rice Phenology with Sentinel-1 SAR Time Series Using a Unified Dynamic Programming Framework.” Open Geosciences 14 (1): 414–28. https://doi.org/10.1515/geo-2022-0369.
Wikipedia. 2016. “Hạn hán miền Nam Việt Nam 2016.” In Wikipedia tiếng Việt. https://vi.wikipedia.org/w/index.php?title=H%E1%BA%A1n_h%C3%A1n_mi%E1%BB%81n_Nam_Vi%E1%BB%87t_Nam_2016&oldid=71940423.
World Bank Group. 2024. “Greening Viet Nam’s Rice Bowl: A Mekong Delta Success Story.” World Bank, May 14. https://www.worldbank.org/en/news/feature/2024/05/14/greening-viet-nam-s-rice-bowl-a-mekong-delta-success-story.
World Business Council for Sustainable Development (WBCSD). 2024. “Roadmap to Nature Positive: Foundations for the Agri-Food System Row Crop Commodities Subsector – Deep Dive: Rice Production in the Mekong Delta, Vietnam.” https://www.wbcsd.org/wp-content/uploads/2024/06/Deep-dive-Rice.pdf.
Xu, Shuai, Xiaolin Zhu, Jin Chen, et al. 2023. “A Robust Index to Extract Paddy Fields in Cloudy Regions from SAR Time Series.” Remote Sensing of Environment 285 (February): 113374. https://doi.org/10.1016/j.rse.2022.113374.
Yang, Lingbo, Limin Wang, Ghali Abdullahi Abubakar, and Jingfeng Huang. 2021. “High-Resolution Rice Mapping Based on SNIC Segmentation and Multi-Source Remote Sensing Images.” Remote Sensing 13 (6): 6. https://doi.org/10.3390/rs13061148.
Yen, Bui Tan, Nguyen Huu Quyen, Trinh Hoang Duong, Duong Van Kham, T. S. Amjath-Babu, and Leocadio Sebastian. 2019. “Modeling ENSO Impact on Rice Production in the Mekong River Delta.” PLOS ONE 14 (10): e0223884. https://doi.org/10.1371/journal.pone.0223884.
Yu, Ki Yull, Chau Tan Phat, and Phan Phuoc Hien. 2019. “EFFECT OF SEEDING METHODS ON RICE YIELD IN MEKONG DELTA.” Southeast-Asian J. of Sciences 7 (2): 190–98.
Zhang, Yu, Tingting Zhu, Gunnar Spreen, et al. 2021. “Sea Ice and Water Classification on Dual-Polarized Sentinel-1 Imagery during Melting Season.” The Cryosphere Discussions, March 30, 1–26. https://doi.org/10.5194/tc-2021-85.
Zhao, Rongkun, Yuechen Li, and Mingguo Ma. 2021. “Mapping Paddy Rice with Satellite Remote Sensing: A Review.” Sustainability 13 (2): 2. https://doi.org/10.3390/su13020503.
Zhao, Xin, Kazuya Nishina, Haruka Izumisawa, Yuji Masutomi, Seima Osako, and Shuhei Yamamoto. 2024. “Monsoon Asia Rice Calendar (MARC): A Gridded Rice Calendar in Monsoon Asia Based on Sentinel-1 and Sentinel-2 Images.” Earth System Science Data 16 (8): 3893–911. https://doi.org/10.5194/essd-16-3893-2024.
Zhu, A.-Xing, Fang-He Zhao, Hao-Bo Pan, and Jun-Zhi Liu. 2021. “Mapping Rice Paddy Distribution Using Remote Sensing by Coupling Deep Learning with Phenological Characteristics.” Remote Sensing 13 (7): 7. https://doi.org/10.3390/rs13071360.
Publisher’s Note
The statements, opinions, and data contained in all publications are solely those of the individual author(s) and contributor(s) and not of Recent Advances S.L. and/or the editor(s). Recent Advances S. L. and/or the editor(s) disclaim responsibility for any injury to people or property resulting from any ideas, methods, instructions, or products referred to in the content.
Appendix

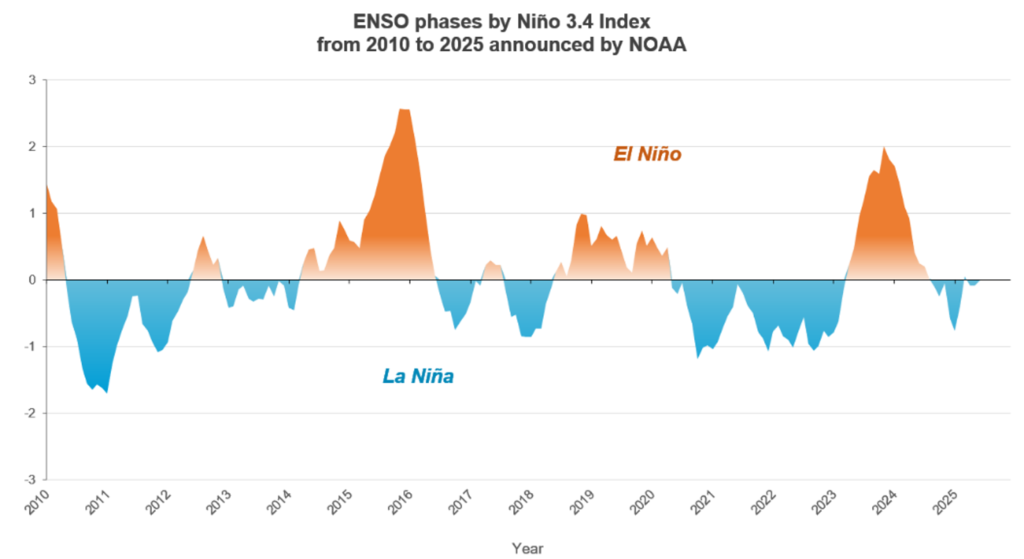
Fig. A1 Records of ENSO phases announced by NOAA from 2010 to 2025, measured using Niño 3.4 Index, show that El Niño occurred in 2015-2016 (very strong), 2019- early 2020 (moderate), 2023-2024 (strong) and La Niña in 2017-2018, mid 2020-2022 (triple-dip)
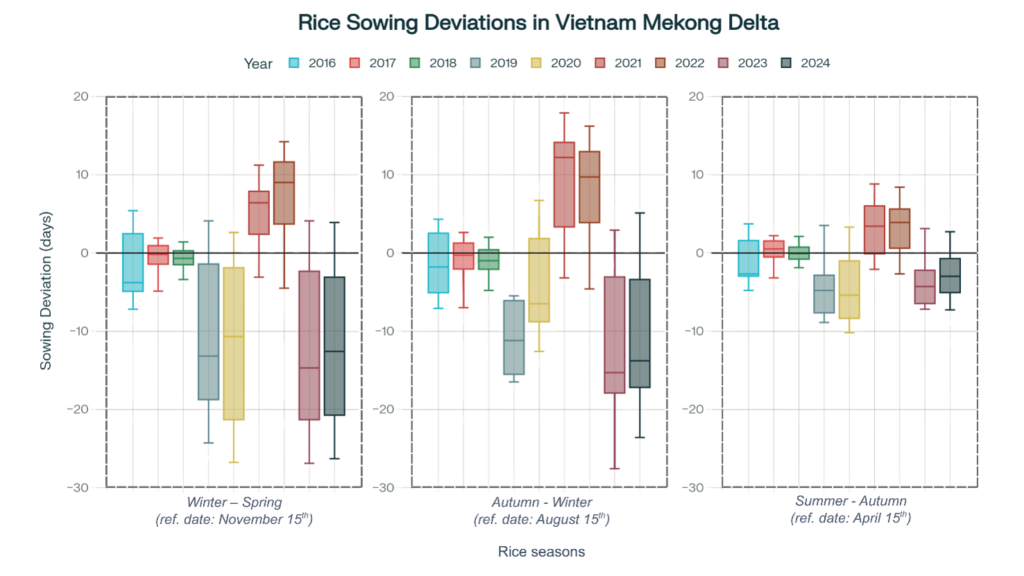
Fig. A2 Box plots of average rice sowing deviations (in days) in the VMD by season where zeros represent reference baseline dates of the respective season