


In-situ validation of Land Surface Phenology, Land Surface Temperature and Surface Water derived from Earth Observation products: Doñana protected area as a potential cal/val supersite
Ricardo Díaz-Delgado

1,2*, 
Diego García-Díaz
1- Laboratory of Remote Sensing & GIS (LAST), Estación Biológica de Doñana-CSIC, Sevilla, Spain.
- Dept. Earth Observation, Spanish Space Agency, Sevilla, Spain.
* Author to whom correspondence should be addressed.


Abstract
In this paper we assess spatial and temporal correlation of different available Earth Observation (EO) products provided through downstream services with in-situ measurements for validation purposes. We selected three relevant ecosystem indicators such as Land Surface Phenology, Land Surface Temperature and Surface Water, being widely available as standard remote sensing products using different methods and satellite sensors. The study seeks to contribute to develop a global framework to address the urgent need for coordinated cal/val activities of EO products. As a pilot, we made use of systematic data collected at Doñana LTSER Platform, one of the long-term measuring sites from the European Research Infrastructure eLTER. In order to enhance EO use we developed the GeeLTERMap tool and PyVPP python package to enable the retrieval of the selected EO products for any site. Phenology metrics estimated by in situ phenocams were used to assess Copernicus High Resolution Vegetation Phenology and Productivity (VPP), MODIS MCD12Q2 and PhenoPy metrics. In situ measurements by calibrated broadband Infrared Radiometers were used to validate LST retrieved from MODIS, Landsat and Sentinel-3 images. Finally, field sampling and in situ automatic camera photos were used to evaluate different multispectral indices and simple bands to map water occurrence using Sentinel-2 images. Results for phenology validation show HR-VPP as the most accurate EO product with an average Root Mean Square Error (RMSE) of 56 days for all metrics across different land covers. For LST, Landsat showed lower RMSE LST values than Sentinel-3 SLSTR and MODIS MOD11A1 products. Finally, Sentinel-2 MSI Band 12 was the most accurate band to delineate water bodies of Doñana shallow marshes. The developed tools and protocols for validation using long-term data from in situ sampling and measurements will be one of the services provided by eLTER Research Infrastructure.Keywords
Earth Observation Products, Copernicus, eLTER RI, cal/val, In situ Validation, Land Surface Phenology, Land Surface Temperature, surface water, supersite, Doñana1. Introduction
Available remote sensing spatially explicit data products provided by the different Earth Observation (EO) programs such as Copernicus or GEO-GEOSS are definitely contributing to enhance and complement the long-term in situ datasets for the monitoring of ecosystem processes and trends subjected to global change. However, most of these products, generated at global or regional scales, require calibration and validation (cal/val). (Sterckx et al., 2020) provided a framework for the calibration and validation of satellite missions. Cal/val activities for satellite missions include pre-launch calibration, in orbit calibration and satellite reference calibration. To get calibrated Level-1 data (e.g. radiance, reflectance and transmittance), post-launch calibration and verification is required. The calibrated Level-1 data are a prerequisite for the retrieval of geo-biophysical Level-2 products such as Leaf Area Index, Biomass, Net Primary Production, Fraction Cover, etc. In order to enable inter-comparison of long time series of satellite images and products it is essential to quantify bias, accuracy and uncertainty among different sensors and eventual sensor drift. Validation also includes algorithm assessment of Level-2 and higher-Level products. For EO product validation, independent in situ estimates of the same measurand are compared to the satellite product.
In situ data collected for validation purposes mainly rely on systematic and accurate field measurements which can easily be used to address EO product reliability or accuracy for end-users. Requirements for the in situ observations include sufficient spatial and temporal coverage and information on their spatial and temporal representativeness (site characteristics and sampling design). Access to in-situ data need to be timely, open and sustainable. Therefore validation activities should play an essential role in maximizing the return of investment of satellite missions by providing the end-user community with an estimate of uncertainty to the delivered EO products by the different programs. As an example, CEOS Working Group on Calibration and Validation (WGCV) on Land Product Validation (LPV) has defined core sites for the satellite land product validation using the following criteria: i) Characterization of the canopy structure and bio-geophysical variables based on well-established protocols useful for the validation of satellite land products (at least 3) and for radiative transfer modelling approaches; ii) Active and long-term operations that are supported by appropriate funding and infrastructural capacity; iii) Supported by airborne LiDAR and hyperspectral acquisitions (desirable). The Copernicus program has recently initiated the Ground-Based Observations for Validation (GBOV) of Copernicus Global Land Products. The GBOV service aims to provide multiple years of high quality in-situ measurements to validate 7 core land products (Top-of-canopy reflectances, Surface albedo, fAPAR, LAI, fCover, Land Surface Temperature and Soil Moisture). Cal/val sites should be able to systematically produce the so-called Fiducial Reference Measurements (FRM) and implement upscaling procedures for validation of moderate resolution sensors (Baccini et al., 2007; Morisette et al., 2006). FRM uncertainty due to spatial and temporal co-location needs to be well characterized. Gruber et al. (2020) provided a good example on the validation process of soil moisture EO products. The arrangement of multiple reference data at a site (e. g. supersites with geophysical, geochemical and atmospheric data sets) would be highly beneficial for the validation of multiple products and sensors.
Interestingly, a mutualistic relationship between Long-Term Ecosystem Research (LTER) networks of sites and EO programs can help to set up a permanent network of cal/val sites (Bayat et al., 2021; Cohen and Justice, 1999; Zacharias et al., 2011). The regional LTER-Europe network consists of more than 500 sites for ecosystem research distributed across Europe. Recently, LTER-Europe has been included in the European Research Infrastructure Forum (ESFRI) roadmap to become a Research Infrastructure (RI) to facilitate high impact research and catalyse new insights about the compounded impacts of climate change, biodiversity loss, soil degradation, pollution, and unsustainable resource use on a range of European ecosystems (eLTER RI). The extensive spatial coverage of the eLTER RI network of sites with existing infrastructure for measuring different components in Earth systems, create a distinct potential for collecting spatially and temporally representative data sets for cal/val of EO products. Doñana LTSER platform, as a formal site of eLTER RI, provides a permanent research infrastructure funded by the Spanish ICTS (Unique Science and Technology Infrastructures) program, named ICTS Doñana. From 2007, we have deployed a network of proximal sensors and probes complementing the long-term ecosystem monitoring performed by traditional sampling techniques, which also includes airborne flight campaigns and drone flights. Environmental data is collected according to harmonized protocols and structured following standard FAIR principles.
In this study, we use in situ data collected in Doñana LTSER platform to assess the accuracy of different selected EO products being considered as informative ecosystem indicator variables by eLTER RI, namely Standard Observations (SO), to monitor global change effects (Ohnemus et al., 2023). Due to its wide availability and accessibility, we selected Land Surface Phenology, Land Surface Temperature and Surface Water related SO. In order to implement equivalent validation procedures for other eLTER sites we developed the GeeLTERMap tool, which enables any end-user to retrieve any of these EO products for any eLTER site across Europe. With this implementation, we are providing a global tool to retrieve the remote sensing available products for any eLTER site across Europe and to retrieve in-situ data to be used for further validation analysis across different ecosystems.
2. Material and Methods
2. 1 EO product selection for in situ validation
For many Earth Observation products, there is not yet a well-defined protocol or method for the collection of available in-situ observations. The validation activities are in many cases adjusted to the available information. According to the available in-situ datasets from eLTER Sites, we selected the following eLTER SO representing different eLTER spheres; Biosphere, Hydrosphere, Geosphere and Sociosphere, (Mirtl et al., 2021; Ohnemus et al., 2023):
- Land Surface Phenology: Under the eLTER Biosphere, the Vegetation Phenology (SOBIO_016) describes the seasonal changes in vegetation greenness and photosynthetic leaf area at the landscape scale, including canopy green-up date (start of season), peak date, senescence date (end of season) and season length, measured in day of year (Anttila et al., 2023). Plant phenological metrics can be calculated from in situ eddy covariance measurements, ground-based imaging such as phenocams or continuous spectral measurements; species-specific phenological observations. Currently no validation protocol exists but different studies based on long-term in-situ measurements have proposed basic approaches (Liu et al., 2016; Moon et al., 2022; Wu et al., 2017; Ye et al., 2022). CEOS LPVS and the Ground-Based Observations for Validation (GBOV) of Copernicus Global Land Products are working on a validation good practice protocol and golden standard LSP validation database (BAI et al., 2019). We tested the Copernicus High Resolution Vegetation Phenology and Productivity (HR-VPP) product (Tian et al., 2021), which provides phenology metrics derived from Sentinel-2 images using the Plant Phenology Index (PPI). Additionally, we tested phenology metrics retrieved by using PhenoPy and NDVI2GIF Python libraries implemented in PhenoApp tool also with Sentinel-2 images (García-Díaz and Díaz-Delgado, 2023) which are now embedded in GeLTERMap as well.
- Surface Water: For the eLTER Hydrosphere, the Water Level (SOHYD_005) is identified as a priority group of eLTER SO to be used for validation of Earth Observation products. Therefore, it is crucial as a first step to delineate water bodies and surface water occurrence for eLTER aquatic sites, either permanent or seasonal wetlands. Surface water maps are usually provided as raster binary masks, which can subsequently be used to retrieve water physico-chemical parameters for those pixels detected as covered by water, discarding terrestrial or non-inundated areas from any further analysis. Therefore, systematic water bodies delineation based on time series of satellite images enables the retrieval of inundation frequency or hydroperiod (Díaz-Delgado et al., 2016), which reveals the effects of extreme climate events such as drought or floods. Hydroperiod trends and anomalies can evidence hydrological changes and effects of watershed management.
- Land Surface Temperature: Under the eLTER Hydrosphere and Geosphere, Soil Surface Temperature (SOHYD_168) is identified as an essential in-situ SO of interest for Earth Observation products validation. Land Surface Temperature (LST) is a widely available Earth Observation product from thermal sensors on-board of different satellites, Although most of them have a coarse spatial resolution (from the 1 km pixel size of MODIS to the 300 m of Sentinel-3) or low revisiting time (such as the 30 m pixel size of the Landsat 8 and 9 satellites), FRM of radiometric temperature can easily be retrieved with in-situ thermal sensors, enabling LST calibration and validation.
2.2. GeeLTERMap: a single tool to retrieve EO products for eLTER sites
The GeeLTERMap python package has been created as a resource for scientists and site managers from the eLTER network to retrieve the selected eLTER SO. GeeLTERMap is based on the Geemap python package (Wu, 2020), a Python API that allows easy access to Google Earth Engine (GEE) datasets and algorithms and provides an interactive map interface (Gorelick et al., 2017). Additionally, through GeeLTERMap, the user has access to all alphanumeric and spatial information from the eLTER Sites as deimspy library (Wohner et al., 2024) is integrated into the tool. Furthermore, by enabling access to all relevant site-related information, the user can set customized filters for eLTER Sites to apply GeeLTERMap specific procedures.
In accordance with the 3 selected eLTER SO, GeeLTERMap includes three different tools (PhenoApp, FloodApp and LSTApp) to access EO products. each one identified by three different colour buttons integrated into a Geemap map environment. Each button provides access to one of these three basic tools of GeeLTERMap described in the following sections. Additionally, a survey form has been included to enable users to submit in-situ data for validation purposes. A video tutorial illustrating the use of all three tools of GeeLTERMap is available online (https://www.youtube.com/watch?v=unxqGwAcBfA&t=2439s).
PhenoApp enables the user to retrieve and calculate Land Surface Phenology metrics of the different land covers in their sites. The application features a dynamic map (Figure 1) which allows eLTER Site selection to visualize phenology metrics for individual or grouped pixels. These “phenometrics” are generated using Sentinel 2 time series of images processed with the Python libraries NDVI2GIF and PhenoPy. PhenoPy takes a stack of Sentinel-2 (L2A GEE dataset of surface reflectance) NDVI images and a text file containing the dates for each image. The software then applies a smoothing algorithm using cubic splines to the curves and calculates the phenological transitions. PhenoPy provides two procedures to perform curve smoothing and identification of inflection points: i) PhenoPy_U based on a single threshold, and ii) PhenoPy_D based on the derivative. This implementation requires pre-calculation for eLTER Sites to be visualized and downloadable. Additionally, PhenoApp includes the MODIS phenology product (MCD12Q2.006) and the Copernicus Sentinel 2 HR-VPP, which requires pre-calculation for eLTER Sites to be visualized and downloadable. Pre-calculation is only available for a few pilot eLTER Sites. The PyVPP package enables users to download HR-VPP products for any eLTER Site. PhenoApp also provides a survey form button to enable users to upload in-situ data on observed phenology metrics collected either by direct observation or phenocams, which might be used to provide a validation assessment of the different EO products.

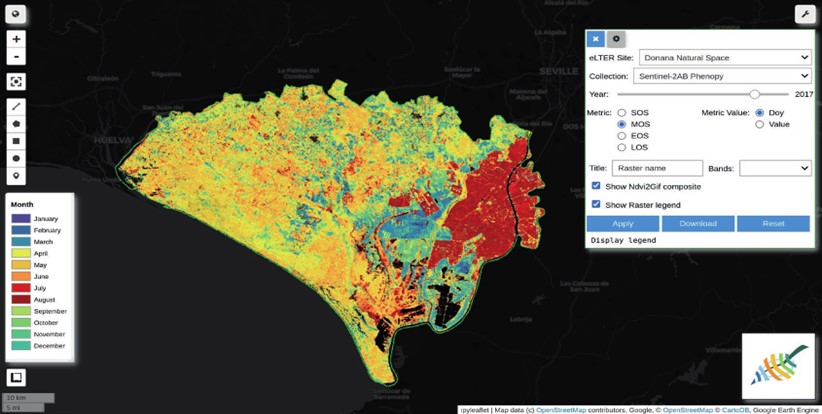
Figure 1. PhenoApp mapping interface showing the phenometric Maximum of Season (MoS) of the year 2017 calculated using PhenoPypackage with Sentinel-2 images for Doñana LTSER platform.
FloodApp is a tool to generate binary masks of water bodies in aquatic eLTER Sites for a specific time period or date. The tool uses the full Landsat time series of images from Landsat satellites (L4, L5, L7, L8 and L9), covering the 1984-2021 period, as well as the Sentinel 2 time series starting from 2017. The tool also enables retrieving pixel statistics in the case the user selects a time period covering multiple images. Statistics include minimum, maximum, mean, median, and percentiles of 10th, 20th, 90th, and 95th for different water indices calculated with the spectral bands of Landsat and Sentinel-2 sensors (TM, ETM+, OLI, OLI2 and MSI). FloodApp includes the calculation of the following water indices: NDWI (McFeeters, 1996), NDWI (Gao et al., 2015), MNDWI (Xu, 2006) and AWEI(SH) (Feyisa et al., 2014). Sentinel-2 and Landsat single surface reflectance bands are also available for simple slicing. Users can set a threshold on any of the indices or bands to delineate water bodies’ area and produce the corresponding raster binary maps to be assessed against in-situ data collected at the targeted eLTER aquatic site. Images used to calculate the water indices can be filtered based on cloud cover in order to exclude highly cloud covered scenes from the calculation. Products can be downloaded to local or virtual environments such as DataLabs (Tso et al., 2021) or Google Colab (Bisong, 2019).
LSTApp also uses GEE API to access LST products from MODIS (MOD11A1) and Landsat (TIRS) collections. LSTApp enables the user to select any eLTER Site, sensor collection, start and end dates, and filter them by percent cloud cover, and choose the LST product and the statistics for image reduction when indicating a timeframe. Likewise for the PhenoApp and FloodApp, a legend on LST values (K) can be displayed if desired on the screen. Users can also download the visualized images. Download limitations may rise according to user platform when downloading a complete LST scene at high spatial resolution covering the eLTER Site. However, users can always define an area of interest using the map drawing tools on the left side of the dynamic map. The GeeLTERMap video tutorial also provides an example on the detailed use of LSTApp.
Complementarily, GeeLTERMap includes FormApp, a simple way to enable the users uploading their in-situ datasets for the specific eLTER SO. Identified by the red icon, users are invited to type in the collector’s name and email, along with the selected site, the coordinates of the measurement point, the year of the measurement and the eLTER SO (Phenometrics, Flood or LST) for which the user provides the long term in-situ data. If the user is providing phenometrics data, he/she should also select the metric (SOS, MOS or EOS) and the Day of the Year (DOY) of the metric. If the user is providing Surface Water (water presence in a point) data, he/she should also tick the “water presence” option and can append the information on the water level by using the specific bar. Finally, if the user is providing LST data, he/she should only provide the in-situ measured surface temperature. All data will be uploaded to a “validation_data.txt” plain text file, which will be further used for validation purposes. FormApp also gives the option to upload a user-defined CSV file with many in-situ measurements which will be stored in the DataLab root folder.
2.3 Validation method for Phenology metrics.
There are several available datasets useful for phenology validation. Direct ground observations are very common, such as the ones provided by the Pan European Phenology (PEP725) project (Templ et al., 2018). Overall, in-situ phenology is considered representative of local vegetation dynamics, especially for forested areas, and ideally when long-term records (>30 years) are available. However, observations are usually made on a limited number of individuals and species, mostly trees, covering a small spatial extent and close to population centres, typically measured only for two seasons (spring and autumn) and recorded below the canopy (Donnelly et al., 2022).
Alternatively, digital camera networks for phenology such as PhenoCam (https://phenocam.nau.edu/webcam/) are affordable and have spread out, providing half-hourly data for hundreds of sites with a high potential for validation of satellite derived phenology metrics (Richardson et al., 2018, 2013). The Red-Green-Blue (RGB) imagery from these cameras is normally used for generating time-series of greenness indices, e.g. the Green Chromatic Coordinate (GCC). The GCC data is calculated from the RGB camera images using the ratio of the green channel digital numbers to the total brightness (summatory of Red, Green and Blue digital numbers of every pixel) of the image as described in Hufkens et al. (2018). The original half-hour GCC time series are aggregated to 1 and 3 days by calculating the 90th percentiles to reduce adverse illumination effects caused by atmospheric influences such as rain, snow, and fog. Images can be processed for the specific region of interest (ROI) inside the picture, i.e., the parts in the image with the target vegetation canopies. There can be multiple ROIs in one image for heterogeneous regions.
For this validation pilot exercise we used phenocam derived phenology metrics (phenometrics). The Doñana LTSER platform has eight phenocams, the oldest starting from 2016, located in different and representative habitats: seasonal marshes, grasslands, perennial woodlands, shrubland, heathland and deciduous woodlands (Figure 2).


Figure 2. Location of Doñana in Europe and of the eight phenocams used for the validation exercise. Exemplary land cover pictures of each phenocam are also shown.
There are many different procedures for validation of satellite derived products. LSP belongs to the higher level products family where not only spatial but also temporal validation has to be assessed. In this pilot exercise we compared the metrics, Start of Season (SoS), Peak of Season (PoS), End of Season (EOS) and Length of Season (LOS) from the four different sources: MODIS, PhenoApp, HR VPP and Phenocams.
For this validation exercise, we set up in the field Ground Control Points (GCP) as visual references to delineate the horizontally projected Phenocam ROI area over Sentinel-2 images. Given the high resolution of Sentinel-2 data, spatio-temporal collocation relied on these Phenocam ROI areas projected over the Sentinel-2 images (Figure 3). Vegetation indices were then retrieved for every cloud-free available Sentinel-2 images covering the whole period (2017-2021) for every phenocam. Depending on the phenocam observation height of every projected ROI area varied between one and ten Sentinel-2 pixels used for the retrieval of vegetation indices. As phenocam images usually have a lateral or oblique point of view and satellite images are captured from a zenithal perspective, specific geometric corrections might be applied case by case. However, we followed a heuristic approach assuming the Sentinel-2 pixel values in the ROI equally representative of every Phenocam ROI area which is averaged for the computation of GCC.


Figure 3. Delineated ROI on top of Sentinel-2 image data retrieval for the calculation of Phenology metrics (left) of the Doñana Torre Palacio phenocam (yellow dot). The image also shows the Sentinel-2 pixel grid (blue lines). Right picture shows the shadowed ROI area on the acquired phenocam pictures.
We first assessed the temporal sensitivity to phenological metrics by every method for all land covers monitored by Doñana phenocams alongside the three consecutive years (2018-2020). Then, we used in-situ phenocam derived metrics to estimate Root Mean Square Error (RMSE), bias and Mean Absolute Error (MAE) for the different EO products and land covers for all available years (2017-2021).
2.4. Validation method for Land Surface Temperature.
For LST validation purposes, calibrated broadband Infrared Radiometers such as the ones provided by Apogee Instruments© or Campbell Scientific IR120 can easily be deployed on site to systematically collect Surface Temperature. In Doñana LTSER Platform three Campbell and three Apogee sensors were mounted together with Eddy Covariance Tower stations in 2014. Until March 2018 the Apogee sensor model was SI-111 measuring the radiometric radiance between 8 to 14 µm. From 2018 onwards, sensors were replaced by the new model SI-411 with the same specifications (more details on the measuring principles and technology can be found here for Apogee and here for Campbell IR120). These radiometers are periodically calibrated using a LAND P80P calibration source from which the precision of the sensors has been assessed in ±0.2 K (Skoković et al., 2017; Sobrino et al., 2015; Sobrino and Skoković, 2016).
For LST validation we used only the data from Fuenteduque site (Figure 4) located in Doñana marshes providing the longest time series of in-situ Land Surface Temperature data (2011-2023). LST in-situ datasets and their processing were produced by the Global Change Unit (Unidad de Cambio Global), Universitat de València. Doñana marshes have a yearly cycle of inundation from autumn to winter, drying out during the spring season. The topography of the marshes is extremely flat, with a maximum elevation difference of 2.5 m a.s.l. Continuous radiometric temperatures are measured with a Campbell Scientific IR120 radiometer. In-situ LST were obtained after correction of thermal radiance from ground-based measurements of surface emissivity and from downwelling irradiance. In order to characterize the surface emissivity, measurements with the CIMEL CE 312-2 multiband radiometer were performed in dedicated field campaigns to obtain the emissivity changes along the year in the different monitored land covers. Spectral emissivities were obtained from the application of the temperature and emissivity separation (TES) method to the measured thermal radiances (Jiménez-Muñoz and Sobrino, 2006). In order to characterize the surface emissivity, measurements with the CIMEL CE 312-2 multiband radiometer were performed in dedicated field campaigns to obtain the emissivity changes along the year. Spectral emissivities were obtained from the application of the temperature and emissivity separation (TES) method to the thermal radiances (Table S3 Appendix A).


Figure 4. Location of the ground-truth point used for the validation of LST product from LSTApp and picture of the installation in the marshes of Doñana LTSER platform.
Landsat 7 ETM+ and Landsat 8 TIRS were also used for LST validation with LST in-situ measurements for the period 2014-2017. In this case, permanent infrared sensors located in Juniper woodlands and open marshes were also used.
Finally, although the Sentinel-3 LST product was not included in the LSTApp, we carried out a validation test. Sentinel-3 imagery was downloaded for the period July-August 2017. Sentinel-3 data included Brightness Temperatures from the SLSTR instrument (level 1 RBT) and the level 2 LST product. L1/RBT data was used to apply the SW algorithm to brightness temperatures (Jimenez et al., 2017). Pixels located at the test site coordinates were identified to extract the L1/RBT and L2/LST values. Atmospherically corrected Sentinel-2 MSI imagery was also downloaded to estimate surface emissivity only for a single date (2017-07-31). Acquisition dates were selected based on a maximum cloud cover over the scenes to guarantee clear sky conditions at least over the test site. In addition to LST SLSTR level 2 product provided by Copernicus SciHub and Wekeo, LSTApp provides LST using the algorithm proposed by (Sobrino et al., 1996) for the retrieval of LST (SW).
2.5. Validation method for Surface Water
Sentinel-2 multispectral images are widely used to delineate water bodies, extent and variability. As water bodies strongly absorb light in the visible to infrared (VNIR) electromagnetic spectrum, Sentinel multispectral bands are suitable to highlight water bodies. Among the different methodologies, the NDWI (Normalized Difference Water Index) is easily calculated using the green (B3) and NIR (B8) bands, and applied to a variety of wetlands using as threshold values from 0.2 to 1 as surface water (McFeeters 1996). However, reflectance in the visible and NIR regions depends on the reflectance of the submerged soil, the water depth, the amount of suspended particles, and their optical properties (Díaz-Delgado et al. 2016, 2010). The abundance of optically active components, such as aquatic vegetation, phytoplankton, suspended minerals, and dissolved organic carbon directly affect water turbidity and color. More turbid water bodies have higher reflectance values in the green and red visible bands. Consequently, there is not a single combination of bands providing accurate water delineation for all kinds of wetlands (ranging from deep lakes to shallow lagoons with high to low chlorophyll concentrations or suspended solids and covered by macrophytes). Therefore, site specific approaches for every wetland are recommended to select the most accurate method based on ground-truth data. GeeLTERMap tool enables the user to get all Sentinel-2 bands and a set of eight multispectral indices widely used for surface water delineation of its wetland eLTER site (Table 1). In this validation exercise we are providing the example for delineating surface water in Doñana marshes. Users can test the accuracy of every band/index in delineating the surface water of a specific wetland following a similar approach according to available in situ data.
We followed a pragmatic approach to assess the accuracy of the different bands and indices by applying classification trees analysis. We built classification trees using all ten Sentinel-2 bands and eight classic multispectral surface water indices for a surface reflectance Sentinel-2 image (Sen2Cor) acquired on 24th April 2017 over Doñana LTSER Platform. For that date we carried out an extensive ground-truth campaign over the inundated marshes covering a transect of 24 km long with a total number of 933 sampling points representative of an area of 30 m radius. Originally, we assigned five different in-situ classes: In (Inundated), Ss (dry soil), Sh (wet soil), Emp (Damp soil) and En (Waterlogged), while for the analysis they were grouped under Inundated (In, Emp and En classes) or Non-inundated (Ss, Sh). Complete details of in-situ sampling are available at Díaz-Delgado et al. (2016).
By using a random training sample of 80% of the ground-truth points we applied classification tree analysis to provide the best classification tree model providing the best threshold and band/index to discriminate between the two grouping classes: inundated versus non-inundated pixels in Doñana marshes with a single Sentinel-2 scene co-occurrent with the in-situ sampling campaign. Predictive accuracy was assessed using the remaining test set from 20% of all sampling points (186 samples) and by computing Cohen’s Kappa statistic in order to measure the degree of classification agreement.
Table 1. Multispectral indices used to assess the classification of surface water with Sentinel-2 images.


Additionally, hydroperiod (the number of days a pixel remains flooded or inundated) can be calculated for specific hydrological cycles to evidence inundation trends for different years (Díaz-Delgado et al., 2016, 2010). In fact, hydroperiod can also be validated using permanent limnimetric scales or water level probes.
3. Results
3.1. Validation results for Phenology metrics
Figure 5 depicts the Day of Year (DOY) of SOS, MOS and EOS for every land cover and method along the three consecutive years. For all comparisons, the PhenoPy_D method seems to be the least sensitive in relation to the phenocam in-situ values. Conversely, HR VPP and PhenoPy_D captures pretty much the dynamics of all land cover types. Among the different metrics, MOS seems to be the most accurately estimated by the different phenological products for all land covers used in the validation pilot exercise (Figure 6).
MAE values (Table S1) also corroborate lower values for PhenoPy_U and HR VPP methods for all land covers. PhenoPy_U method shows better performance for Marsh ponds and Open marshes than for the other classes (MAE<20 days) while HR VPP works better for Heathland and Juniper woodlands. The most accurate metric is MOS for all remote sensing methods. However, PhenoPy_U shows better concordance for SOS and LOS than for MOS and EOS.


Figure 5. Day Of Year (DOY) of SOS, MOS and EOS phenology metrics for every land cover and method along 3 consecutive years (2018-2020).


Figure 6. Box-whisker plots of the 4 different phenology metrics (DOY values) for the four different EO products (MODIS, HR-VPP, PhenoPy_U and PhenoPy_D) versus the phenocam values for all land covers in the validation exercise using Doñana phenocams.
We used in-situ phenocam derived metrics to estimate Root Mean Square Error (RMSE), bias and MAE for the different EO products (Figure 7) for all available years (2017-2021). Overall, the most accurate EO product was the HR-VPP with an average RMSE of 56 days for all metrics and land covers. Our method using PhenoPy_U, based on the thresholding of transitions, shows an average RMSE of 60 days, followed by MODIS product with RMSE = 64 days and PhenoPy_D with a very high RMSE value of 119 days. In assessing the RMSE metric by metric, SOS, EOS and LOS DOYs estimated by PhenoPy_U were closer to phenocam derived metrics. Only for MOS, the HR-VPP product provided lower RMSE values of 34 days in comparison to PhenoPy_U RMSE of 82 days on average. It seems that both methods would be the most accurate to monitor long-term changes in phenology for different land covers. However, as the eight phenocams used for this pilot validation exercise are pointing at very different land covers, including inundated areas, the assessment of RMSE also reveals the most accurate EO products per land cover (Figure 8).


Figure 7. Average RMSE in days, calculated for the different EO products available for every phenology metric (SOS- Start of Season, MOS- Maximum of Season, EOS- End of Season and LOS- Length of Season).


Figure 8. Average RMSE in days calculated for the different EO products available for every phenology metric (SOS- Start of Season, MOS- Maximum of Season, EOS- End of Season and LOS- Length of Season) and land cover. Confidence intervals calculated with the associated standard error.
Table 2 shows the average RMSE values for all metrics estimated by the different EO products according to the monitored land cover. PhenoPy_U methods show the most accurate estimates unless for Heathland (dominated by Erica sp.) and Juniper woodlands, for which the HR-VPP products show a closer estimate of all metrics.
Table 2. Average metric RMSE values in days of the different EO products per land cover. Values in bold indicate the most accurate product for the specific land cover.
| Land cover | MODIS | HR-VPP | PhenoPy_D | PhenoPy_U |
| Marsh pond | 44.91 | 33.11 | 71.83 | 21.46 |
| Shrubland | Not available | 39.43 | 112.25 | 23.18 |
| Poplar trees | 99.60 | 69.64 | 126.46 | 59.20 |
| Water course | 54.93 | 81.55 | 48.80 | 48.58 |
| Open marshes | 39.41 | 57.87 | 68.73 | 24.27 |
| Heathland | Not available | 46.21 | 157.77 | 95.35 |
| Juniper woodlands | Not available | 30.10 | 156.05 | 76.14 |
3.2. Validation results for Land Surface Temperature
For the MOD11A1 (previously MYD11) product we used the time series of in-situ data from 2011 to 2020 (Figure 9). Average RMSE for the period was 2.28 K.


Figure 9. Regression of MODIS day LST product values versus in-situ LST measurements in Doñana marshes. Left chart shows values from 2011 to 2015 and the right chart those values from 2016 to 2020. Extracted from (Skokovic et al., 2022).
RMSE values for LST derived from Landsat 7 ETM+ varied from 1.1 K to 1.3 K, while for LST derived from Landsat 8 TIRS varied from 1.7 K to 2.4 K (Skoković et al., 2018, 2017). Finally, RMSE values of Sentinel-3 LST Level-2 product were lower, 0.19 K, than the estimated using the SW method (-0.41 K) (Jimenez et al., 2017).
3.3. Validation results for Surface Water
In order to select the best threshold for a time series of images, it is recommended to perform an inter-scene cross-validation approach (Davranche et al., 2013). The proposed threshold should be consistent throughout years, sensors, illumination angles, and land cover changes. For instance, a Jackknife procedure allows calculating the classification agreement for each subsample of images, omitting the ith observation to estimate the previously unknown agreement value. This inter-scene cross-validation usually consists of three steps:
1. Computing classification trees, using the whole set of training images except for one of them each time, which was used as a validation image.
2. Computing the classification tree using all the training images.
3. Evaluating threshold accuracies from all training images classification tree over the validation image with the ground-truth data for the corresponding date.
Optimal threshold can then be applied to every eLTER Site by systematically producing water masks with its associated accuracy value for all scenes, as validation measurement. FloodApp enables testing different thresholds for the several water indices and bands for every eLTER site, which can be very useful to eLTER PIs in selecting the most accurate method for delineating water bodies or inundation masks. However, users are encouraged to upload in-situ data in order to numerically test the most accurate method.
The best band/index to discriminate water bodies from non-inundated areas in Doñana shallow marshes was Sentinel-2 MSI B12 (2190 nm) for reflectance values < 0.0561 as the best threshold with an overall accuracy of 97.32% (Omission error = 0.21% and Commission error = 2.68%) and a Kappa Index of 0.90 (Figure 10).


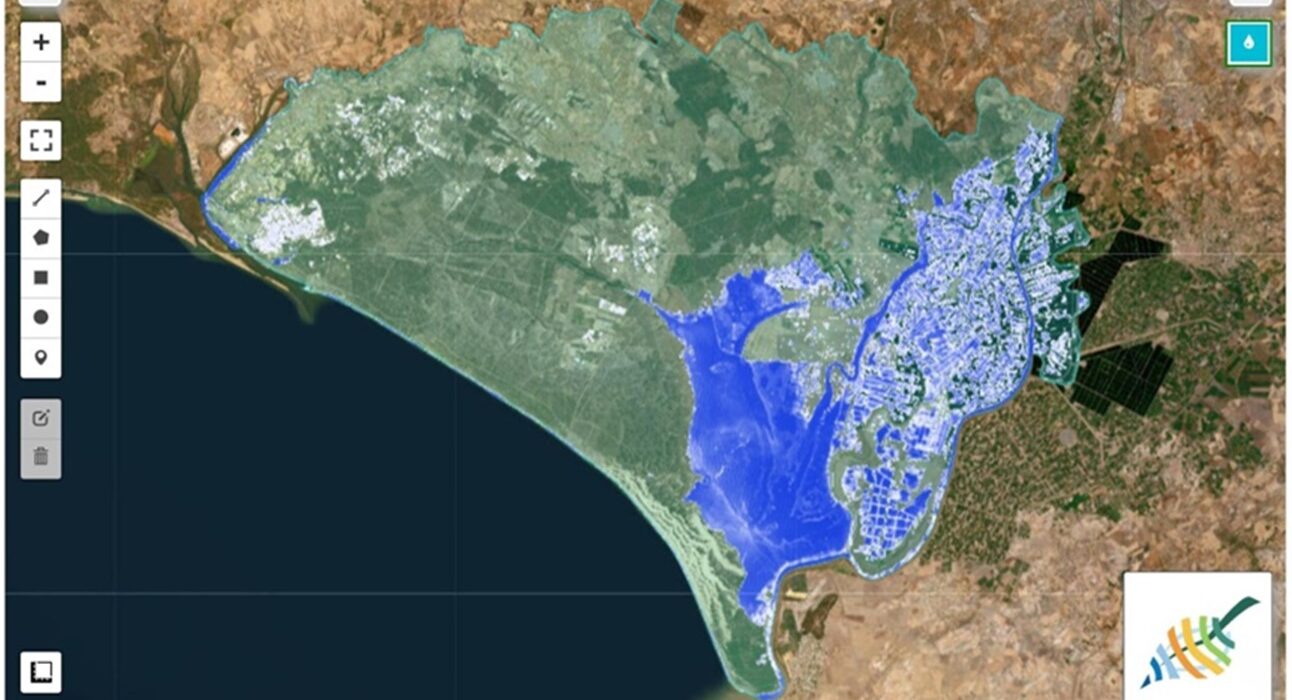
Figure 10. Surface water map of Doñana LTSER platform provided by GeeLTERMap using Sentinel-2 MNDWI values, with a threshold set to 0, and maximum values for February 2010.
4. Discussion
4.1. On the in-situ needs and requirements for validation purposes
Our pilot study has revealed the ease of using Phenocams to monitor systematically vegetated land cover dynamics. Near-surface remote sensing with digital web cameras has become the most widely used source of validation data for satellite-derived land surface phenology. A protocol for the observation of canopy phenology using digital cameras for the ICOS ecosystem sites is available at https://european-webcam-network.net/data/ICOS_Phenocamera_WG_Protocol_final.pdf, including recommendations for camera installation, orientation, and processing as well as required metadata. Instructions for the installation and set-up of cameras are also provided by the Phenocam Network in the US (https://phenocam.nau.edu/webcam/tools/). There are many algorithms available for the analysis of digital images to create time series of vegetation color indices and determine phenological dates. An example of an open-source software is the Phenopix R package (Filippa et al., 2016). It provides standardized processing algorithms for extraction of vegetation color indices and the dates of phenological events. Additionally, software routines were developed by the Phenocam network in the US, e. g. for the delineation of the region of interest (xROI, https://github.com/bnasr/xROI). More recently, the Finnish Meteorological Institute has developed FMIProt, a system for multiple camera networks for continuous monitoring of ecosystems by processing image time series from phenocams (Tanis et al., 2018), which includes data acquisition, processing and visualization from multiple camera networks. The users can implement their own developed algorithms to extract information from digital image series for any purpose.
As for LST validation, there are several field instruments to measure thermal radiance. Apogee Instruments© or Campbell Scientific IR120 rugged sensors can easily be deployed on site to systematically collect Surface Temperature calculated from thermal radiance. Usually, the spectral range of these sensors is from 8 to 14 μm, with an operating temperature range from −40 °C to 80 °C, a manufacturer accuracy of ±0.5 °C and a measurement range of –60 °C to 110 °C. Apogee radiometers, for instance, are routinely used as a validation source for satellite and UAV-based studies that involve retrieval of LST (Aragon et al., 2020). Field installation and set-up of these sensors will require permanent power supply and in-situ data logger recording. Solar electric power systems can amply maintain IR sensors. A data logger is also necessary to store data. A complete installation would cost about 2000€. IR sensors would eventually require re-calibration or vicarious calibration on site, as well as low maintenance to clean up sensor lenses and review sensor position and FOV. Although the test sites represent different land covers (bare soil, vegetation, and water) with a moderate range of emissivities (0.95–0.99, Table S3 Appendix A) validation over additional sites is recommended in order to test LST algorithms over extreme atmospheric conditions. Additionally, in-situ sensors have to be analysed for sensitivity to emissivity errors.
As for surface water validation, field campaigns should be designed to be coincident with Sentinel-2 or Landsat 8 and 9 acquisitions over the target Site. Overpass schedules are available for any site in the world (Sentinel-2 and Landsat). Field campaigns should mainly focus on collecting as many different locations as possible inside the wetland area with the purpose to cover as much as possible the inundated area. The minimum required variable to record is water presence or absence. Water presence is defined as a homogeneous cover of standing water at the location coordinates for at least a surface of one to three pixels (for Sentinel-2 100 to 900 m2 and Landsat 900 to 8100 m2). GPS coordinates are to be collected in the center of the area covered by water. Depending on site accessibility, in-situ data collection can be designed for points along a transect, which increases sampling efficiency. In such a case, it is also recommended to record the GPS track. For heterogeneous inundated areas, transects can be done by driving qualified vehicles, riding horses, or just by walking. It is critical to collect not only coordinates for the inundated areas but also for dry locations in order to have a balanced sample. Inundation categories can be more detailed than simply inundated and non-inundated, collecting mixed situations such as damp, wet or waterlogged. Identifying many flooding categories will also help in later classification. Ancillary measurements of water depth, percent of bare surface water and percent cover of aquatic plants (emergent, floating or submerged) are also recommended to better characterize wetlands heterogeneity and test different flood mapping methods and spectral indices. Eventually, water turbidity and chlorophyll concentration measurements can enhance further analysis for other SO, although these require collection of water samples for later application of laboratory analytical protocols.
4.2. Overall assessment of available remote sensing products
Land surface phenology products showed an averaged low accuracy while assessing all phenometrics for all types of land covers (PPI HR-VPP RMSE=56 days; PhenoPy_U RMSE=60 days). However, some of the validated land covers provide more accurate estimates for marshes and shrublands (PhenoPy_U RMSE values between 21 and 23 days) or for Juniper woodlands (HR-VPP PPI RMSE=30 days). On average, the most accurate phenology metric was MOS (RMSE=60 days), and the most accurate method for SOS, EOS y LOS was Phenopy_U, while for MOS was the HR-VPP. Tian et al. (2021) found similar values of mean absolute bias for the GCC derived from phenocams (17-25 days for SOS and 36-38 days for EOS). This exercise of validation clearly reveals the need for setting up new in situ permanent phenological monitoring phenocams which will certainly contribute to better quantify uncertainty values to Land Surface Phenology satellite products. A network of harmonized phenocam measurements such as the Phenocam Network (Richardson et al., 2018) located in eLTER sites where other complementary variables are registered such as Gross Primary Production (GPP) or Evapotranspiration will enable further and more complete validation exercises for different habitats and ecosystems. Addressing trends and shifts in phenological metrics is a critical task to better understand climate change effects on ecosystems and predict implications for ecosystem functioning and services (Henebry and de Beurs, 2013).
On the use of phenocams as in situ validation sensors, it is also relevant to highlight that ROI averaging of pixel values observed by the phenocam are also biased by the prominent elements in the forefront. This issue can be reduced by placing ROI areas in such elements or by applying Inverse Distance Weighting models in the calculation of GCC for the observed ROI. In addition, radial lens correction may also be recommended in the georeferencing process for upscaling purposes.
Concerning the LST, the validation exercise reveals low RMSE values for all sources, more accurate for Sentinel-3 LST standard product. High thermal heterogeneity observed at the Doñana marshes validation site in summer is due to the mixture of dry vegetation and dry soil which can lead to significant emissivity variability among years. Furthermore, our validation exercise assessed LST accuracies for different ecosystems and land covers, which should be considered while developing a cal/val network. Still, validation of longer time series together with cross-calibration of in situ sensors will definitely enhance the inter-comparison and allow detecting eventual inconsistencies of satellite’s instruments, such as calibration drift or outliers due to undetected clouds.
Finally, mapping of water bodies or surface water is a challenging task for all kinds of wetlands. Water depth, turbidity, chlorophyll content, presence and abundance of aquatic vegetation are some of the factors that critically contribute to fuzzy spectral signatures reducing mapping accuracies. Our GeeLTERMap tool allows the user to apply different spectral indices for surface water as well as to test different thresholds using ground truth data. This is actually the case of Doñana temporary marshes where discrimination of flooded areas may be hampered by the mixed contribution of all these factors (Díaz-Delgado et al., 2016). Nevertheless, single band slicing was identified as the best method, as soon as coincident in situ data is provided.
Our validation approach may be considered for future EO missions as long as harmonized and standardized validation protocols are used throughout a network of cal/val sites covering different ecosystems.
4.3. Doñana as a supersite for cal/val and eLTER service implementation
Most of the Doñana LTSER platform (78%) has an environmental protection either as a National or Natural parks. On the other hand, ICTS Doñana is committed with the Doñana long-term ecological monitoring program by securing sensor’s maintenance, sampling campaigns, skilled staff, data and metadata management and services provision. Both conditions are essential to grant in situ data provision for cal/val purposes. For instance, 4 eddy covariance towers placed in 4 different ecosystems are providing energy, carbon and water fluxes in a standardised way to the scientific community (European Fluxes Database Cluster). Half-hourly estimates of GPP have successfully been used for validation of Sentinel-2 derived GPP maps using a light use efficiency (LUE) model (Gómez-Giráldez et al., 2024a; Spinosa et al., 2023). Curated time series of in situ data also enable testing different retrieval methods of the selected parameter. For instance, a network of permanent field spectroradiometers (Ramses-Trios) on different Doñana wetlands has been used for validation of different methods for the early detection of cyanobacterial blooms (Martínez-Fornós et al., 2025) with Sentinel-2 images. Currently, Doñana has also been integrated in the SpaFLEX initiative, a network of cal/val sites in Spain for the upcoming European Space Agency’s FLuorescence Explorer Sentinel 3 (ESA FLEX-S3) mission on vegetation fluorescence (Gómez-Giráldez et al., 2024b). A set of in situ measurements protocols and uncertainty budget is being prepared to comply with mission requirements. All these examples make Doñana a suitable supersite for cal/val of different biophysical parameters in natural ecosystems.
The eLTER Research Infrastructure has incorporated EO products as a major source of data for eLTER sites to complement the in situ long-term monitoring of its SO. In its turn, eLTER is proposing to the major EO programs such as Copernicus, a harmonized and standardized time series of data for the different SO suitable for in situ cal/val activities. The eLTER services portfolio, with 164 services structured in 7 Thematic Service Areas (TSA) has identified a service on Technical consultation on SO provision for EO cal/val purposes. The proposal is aligned with the ESA Cal/Val Park User Consultation and will provide the following functionalities:
- Technical advice to eLTER site and platform coordinators considering to provide SO data adapted to serve as in-situ calibration and validation data for Earth observation products
- Technical advice and broker between major Earth Observation data providers (Copernicus/EEA, ESA) aiming to integrate eLTER in-situ data.
- Continuous exchange with the Copernicus In-situ component led by European Environmental Agency, relevant subgroups of the CEOS Calibration & Validation Working Group, GBOV, ESA, with the aim of identifying potential in-situ data and co-designing the technical and SO capabilities of eLTER to provide operational in-situ data
- Maintain close connection to eLTER TSA on data provision and eLTER RI Head Office to agree on strategic actions
Undoubtedly, this eLTER service will contribute to set up a permanent collaboration with the major EO distributors and to better define the in situ requirements for cal/val of EO products. Moreover, eLTER is also committed to co-location activities with other European Environmental Research Infrastructures such as LifeWatch-ERIC, ICOS-Eric, Actris or ANAEE. Co-location seeks to integrating RI networks through site co-location and standardised observation methods (Futter et al., 2023). Through participation in two or more RIs (i.e., co-location), adoption of standardised observation protocols, uniform and well documented quality assurance and quality control (QA/QC) workflows and a commitment to FAIR (Findable, Accessible, Interoperable, Reusable; (Stall et al., 2019)) data principles, the scientific and societal value of both sites and RIs are greater than the sum value of their individual elements.
5. Conclusions
The tools and workflows presented herein should be considered as enabling technologies. Hopefully researchers and stakeholders from across the eLTER network will recognize the breadth of historic EO data currently available, along time lines and over the variety of spectral bands. The exponentially increasing data acquisitions from new satellites present challenges and opportunities unavailable only a decade ago.
Therefore, modern ecological research cannot thrive on predefined, static variables. The dynamic workflow presented in this work, and supported by a toolbox of flexible software applications can be the mainstay of provision of downstream services by eLTER RI. It is the authors hope that, moving toward eLTER RI, this approach consisting of elastic and extensible analyses of EO data will become part of the groundwork for eLTER RI services and products.
One of the key conclusions from our work is the immense potential for ecological monitoring through remote observation by integrating vast stores of image datasets and spatial data, such as those provided by Google Earth Engine (GEE), with DEIMS. Both together made it so much easier to provide tailored products for every eLTER Site. What becomes an incredibly powerful tool that paves the way for advanced long-term ecological monitoring and validation of EO products to improve information clusters.
Finally, GeeLTERMap is a Python tool that will keep evolving in the near future. Next steps will focus on time series analysis (trends, shifts), improve map interactivity and visualization of phenology on the fly for all eLTER Sites through the temporal analysis of Sentinel-2 and Sentinel-3 time series of images.
Authors contribution
Conceptualization, R.D-D.; methodology, D.G-D. and R.D-D.; software, D.G.-D.; data curation, D.G-D. and R.D-D.; writing, review, and editing, R.D.-D.; graphical deployment, D.G-D. and R.D-D.; supervision, R.D.-D. Both authors have read and agreed to the published version of the manuscript.
Data
Ground-truth dataset used for the surface water validation analysis is available at Zenodo repository (https://doi.org/10.5281/zenodo.17158473)
Python package of GeeLTERMap is available at GitHub repository (https://github.com/Digdgeo/GeeLTERMap)
A specific video on the use of GeeLTERMap is available at https://www.youtube.com/watch?v=unxqGwAcBfA
A dedicated presentation on PhenoApp is available at https://slides.com/diegogarciadiaz/deck-735fe5 (presented during the eLTER Software workshop – Introducing new tools
Declaration of competing interest
The authors declare that they have no known competing financial interests or personal relationships that could have appeared to influence the work reported in this paper.
Acknowledgements
The authors want to sincerely acknowledge the ICTS Doñana team for providing full support for the deployment of sensors and data access. Authors are also grateful to Carmela Marangi, Micha Silver, Alessandro Oggioni, Paolo Tagliolato, Arnon Karnieli, Johannes Peterseil, Saverio Vicario, Saku Anttila, Kristin Böttcher, Will Bolton, Christoph Wohner, Vladan Minić, co-authors of eLTER Plus Deliverable 4.4 and to Ulf Mallast, Rita Bastos, Jan Dick, Jaana Bäck and Marie-Noelle Pons as reviewers of the deliverable. We deeply acknowledge the provision of LST in-situ datasets by Drazen Skokovic and José A. Sobrino from the Global Change Unit (Unidad de Cambio Global), Universitat de València and for their continuous support. Finally, we sincerely thank the two anonymous reviewers and the RARS editor for their great recommendations and revision of the manuscript which have largely improved it.
Funding
This work has been funded by the EU Horizon 2020 Infraia project eLTER PLUS (Grant agreement No. 871128). Our work has also been partially funded by the Spanish Ministry of Science (MICIN) through the CEOS-Spain research project (PID2020-112494RB-I00 IPL-LSTM) and SUMHAL project by European Regional Development Fund [LIFEWATCH-2019-09-CSIC-4, POPE 2014-2020]. Finally, the proposal of Doñana as a supersite for cal/val is funded by the MICIN research projects SpaFLEXVal (PID2022-137022OB-C33) and PCI2023-145988-2.
References
Anttila, S., Böttcher, K., Mallast, U., Marangi, C., Peng, J., Zacharis, S., Díaz-Delgado, R., Vicario, S., Garcia, D., Bäck, J., Mirtl, M., Schaub, M., Trotsiuk, V., 2023. Requirements for in-situ observations in the calibration/validation process of Earth Observation data. https://doi.org/10.5281/zenodo.8099856
Aragon, B., Johansen, K., Parkes, S., Malbeteau, Y., Al-Mashharawi, S., Al-Amoudi, T., Andrade, C.F., Turner, D., Lucieer, A., McCabe, M.F., 2020. A Calibration Procedure for Field and UAV-Based Uncooled Thermal Infrared Instruments. Sensors 20, 3316. https://doi.org/10.3390/s20113316
Baccini, A., Friedl, M.A., Woodcock, C.E., Zhu, Z., 2007. Scaling Field Data to Calibrate and Validate Moderate Spatial Resolution Remote Sensing Models. Photogrammetric Engineering & Remote Sensing 73, 945–954. https://doi.org/10.14358/PERS.73.8.945
BAI, G., DASH, J., BROWN, L., MEIER, C., LEREBOURG, C., RONCO, E., LAMQUIN, N., BRUNIQUEL, V., CLERICI, M., GOBRON, N., 2019. GBOV (Ground-Based Observation for Validation): A Copernicus Service for Validation of Vegetation Land Products, in: IGARSS 2019 – 2019 IEEE International Geoscience and Remote Sensing Symposium. Presented at the IGARSS 2019 – 2019 IEEE International Geoscience and Remote Sensing Symposium, pp. 4592–4594. https://doi.org/10.1109/IGARSS.2019.8898634
Bayat, B., Camacho, F., Nickeson, J., Cosh, M., Bolten, J., Vereecken, H., Montzka, C., 2021. Toward operational validation systems for global satellite-based terrestrial essential climate variables. International Journal of Applied Earth Observation and Geoinformation 95, 102240. https://doi.org/10.1016/j.jag.2020.102240
Bisong, E., 2019. Google Colaboratory, in: Bisong, E. (Ed.), Building Machine Learning and Deep Learning Models on Google Cloud Platform: A Comprehensive Guide for Beginners. Apress, Berkeley, CA, pp. 59–64. https://doi.org/10.1007/978-1-4842-4470-8_7
Cohen, W.B., Justice, C.O., 1999. Validating MODIS Terrestrial Ecology Products: Linking In Situ and Satellite Measurements. Remote Sensing of Environment 70, 1–3. https://doi.org/10.1016/S0034-4257(99)00053-X
Davranche, A., Poulin, B., Lefebvre, G., 2013. Mapping flooding regimes in Camargue wetlands using seasonal multispectral data. Remote Sensing of Environment 138, 165–171. https://doi.org/10.1016/j.rse.2013.07.015
Díaz-Delgado, Aragonés, David, Afán, Isabel, Bustamante, Javier, 2016. Long-Term Monitoring of the Flooding Regime and Hydroperiod of Doñana Marshes with Landsat Time Series (1974–2014). Remote Sensing 8, 775. https://doi.org/10.3390/rs8090775
Díaz-Delgado, R., Aragonés, D., Ameztoy, I., Bustamante, J., 2010. Monitoring marsh dynamics through remote sensing, in: Hurford, C., Scheneider, M., Cowx, I. (Eds.), Conservation Monitoring in Freshwater Habitats. Springer, Dordrecht, Heidelberg, London, New York, pp. 375–386. https://doi.org/10.1007%2F978-1-4020-9278-7_31
Donnelly, A., Yu, R., Jones, K., Belitz, M., Li, B., Duffy, K., Zhang, X., Wang, J., Seyednasrollah, B., Gerst, K.L., Li, D., Kaddoura, Y., Zhu, K., Morisette, J., Ramey, C., Smith, K., 2022. Exploring discrepancies between in situ phenology and remotely derived phenometrics at NEON sites. Ecosphere 13, e3912. https://doi.org/10.1002/ecs2.3912
Feyisa, G.L., Meilby, H., Fensholt, R., Proud, S.R., 2014. Automated Water Extraction Index: A new technique for surface water mapping using Landsat imagery. Remote Sensing of Environment 140, 23–35. https://doi.org/10.1016/j.rse.2013.08.029
Filippa, G., Cremonese, E., Migliavacca, M., Galvagno, M., Forkel, M., Wingate, L., Tomelleri, E., Morra di Cella, U., Richardson, A.D., 2016. Phenopix: A R package for image-based vegetation phenology. Agricultural and Forest Meteorology 220, 141–150. https://doi.org/10.1016/j.agrformet.2016.01.006
Futter, M.N., Dirnböck, T., Forsius, M., Bäck, J.K., Cools, N., Diaz-Pines, E., Dick, J., Gaube, V., Gillespie, L.M., Högbom, L., Laudon, H., Mirtl, M., Nikolaidis, N., Poppe Terán, C., Skiba, U., Vereecken, H., Villwock, H., Weldon, J., Wohner, C., Alam, S.A., 2023. Leveraging research infrastructure co-location to evaluate constraints on terrestrial carbon cycling in northern European forests. Ambio 52, 1819–1831. https://doi.org/10.1007/s13280-023-01930-4
Gao, Y., Gao, J., Yin, H., Liu, C., Xia, T., Wang, J., Huang, Q., 2015. Remote sensing estimation of the total phosphorus concentration in a large lake using band combinations and regional multivariate statistical modeling techniques. J. Environ. Manage. 151, 33–43. https://doi.org/10.1016/j.jenvman.2014.11.036
García-Díaz, D., Díaz-Delgado, R., 2023. PhenoApp. Una aplicación basada en Google Earth Engine para el monitoreo de la fenología: Revista de Teledetección 73–81. https://doi.org/10.4995/raet.2023.18767
Gómez-Giráldez, P.J., Cristóbal, J., Nieto, H., García-Díaz, D., Díaz-Delgado, R., 2024a. Validation of Gross Primary Production Estimated by Remote Sensing for the Ecosystems of Doñana National Park through Improvements in Light Use Efficiency Estimation. Remote Sensing 16, 2170. https://doi.org/10.3390/rs16122170
Gómez-Giráldez, P.J., Jiménez, M., Cendrero-Mateo, M.P., Van Wittenberghe, S., Peón, J.J., Moncholí-Estornell, A., Delegido, J., Moreno, J.F., Díaz-Delgado, R., 2024b. The Spafleximp Project: Spanish Flex-S3 Mission Calibration and Validation Plan Implementation, in: IGARSS 2024 – 2024 IEEE International Geoscience and Remote Sensing Symposium. Presented at the IGARSS 2024 – 2024 IEEE International Geoscience and Remote Sensing Symposium, pp. 296–300. https://doi.org/10.1109/IGARSS53475.2024.10640946
Gorelick, N., Hancher, M., Dixon, M., Ilyushchenko, S., Thau, D., Moore, R., 2017. Google Earth Engine: Planetary-scale geospatial analysis for everyone. Remote Sensing of Environment, Big Remotely Sensed Data: tools, applications and experiences 202, 18–27. https://doi.org/10.1016/j.rse.2017.06.031
Gruber, A., De Lannoy, G., Albergel, C., Al-Yaari, A., Brocca, L., Calvet, J.-C., Colliander, A., Cosh, M., Crow, W., Dorigo, W., Draper, C., Hirschi, M., Kerr, Y., Konings, A., Lahoz, W., McColl, K., Montzka, C., Muñoz-Sabater, J., Peng, J., Reichle, R., Richaume, P., Rüdiger, C., Scanlon, T., van der Schalie, R., Wigneron, J.-P., Wagner, W., 2020. Validation practices for satellite soil moisture retrievals: What are (the) errors? Remote Sensing of Environment 244, 111806. https://doi.org/10.1016/j.rse.2020.111806
Henebry, G.M., de Beurs, K.M., 2013. Remote Sensing of Land Surface Phenology: A Prospectus, in: Schwartz, M.D. (Ed.), Phenology: An Integrative Environmental Science. Springer Netherlands, Dordrecht, pp. 385–411. https://doi.org/10.1007/978-94-007-6925-0_21
Hufkens, K., Basler, D., Milliman, T., Melaas, E.K., Richardson, A.D., 2018. An integrated phenology modelling framework in r. Methods in Ecology and Evolution 9, 1276–1285. https://doi.org/10.1111/2041-210X.12970
Jiménez, J., Sobrino, J., Soria, G., Julien, Y., Skokovic, D., Gomis-Cebolla, J., Mattar, C., Santamaría-Artigas, A., Pasapera-Gonzales, J., 2017. Early validation results of the land surface temperature product derived from Sentinel-3 SLSTR instrument. In: Fifth recent advances in quantitative remote sensing, J.A. Sobrino (Ed.), pp. 206-210. Universitat de Valencia, Valencia, Spain. ISBN: 978-84-9133-201-5
Jiménez-Muñoz, J.C., Sobrino, J.A., 2006. Emissitivity spectra obtained from field and laboratory measurements using the temperature and emissivity separation algorithm. Appl Opt 45, 7104–7109. https://doi.org/10.1364/ao.45.007104
Liu, Y., Wu, C., Peng, D., Xu, S., Gonsamo, A., Jassal, R.S., Altaf Arain, M., Lu, L., Fang, B., Chen, J.M., 2016. Improved modeling of land surface phenology using MODIS land surface reflectance and temperature at evergreen needleleaf forests of central North America. Remote Sensing of Environment 176, 152–162. https://doi.org/10.1016/j.rse.2016.01.021
Martínez-Fornós, G., Talone, M., Cobos, J., Bustamante, J., Díaz-Delgado, R., 2025. A semi-automatic remote-sensing-based system for the early detection of cyanobacterial blooms: the case of the Doñana National Park (Spain). Wetlands 45, 79. https://doi.org/10.1007/s13157-025-01962-4.
McFeeters, S.K., 1996. The use of the Normalized Difference Water Index (NDWI) in the delineation of open water features. International Journal of Remote Sensing 17, 1425–1432. https://doi.org/10.1080/01431169608948714
Mirtl, M., Kuhn, I., Montheith, D., Bäck, J., Orenstein, D., Provenzale, A., Zacharias, S., Haase, P., Shachak, M., 2021. Whole System Approach for in-situ research on Life Supporting Systems in the Anthropocene (WAILS) EGU21-16425. https://doi.org/10.5194/egusphere-egu21-16425
Moon, M., Richardson, A.D., Milliman, T., Friedl, M.A., 2022. A high spatial resolution land surface phenology dataset for AmeriFlux and NEON sites. Sci Data 9, 448. https://doi.org/10.1038/s41597-022-01570-5
Morisette, J.T., Baret, F., Privette, J.L., Myneni, R.B., Nickeson, J.E., Garrigues, S., Shabanov, N.V., Weiss, M., Fernandes, R.A., Leblanc, S.G., Kalacska, M., Sanchez-Azofeifa, G.A., Chubey, M., Rivard, B., Stenberg, P., Rautiainen, M., Voipio, P., Manninen, T., Pilant, A.N., Lewis, T.E., Iiames, J.S., Colombo, R., Meroni, M., Busetto, L., Cohen, W.B., Turner, D.P., Warner, E.D., Petersen, G.W., Seufert, G., Cook, R., 2006. Validation of global moderate-resolution LAI products: a framework proposed within the CEOS land product validation subgroup. IEEE Transactions on Geoscience and Remote Sensing 44, 1804–1817. https://doi.org/10.1109/TGRS.2006.872529
Ohnemus, T., Zacharias, S., Dirnböck, T., Bäck, J., Brack, W., Forsius, M., Mallast, U., Nikolaidis, N.P., Peterseil, J., Piscart, C., Pando, F., Poppe Terán, C., Mirtl, M., 2023. The Elter Research Infrastructure: Current Design and Coverage of Environmental and Socio-Ecological Gradients. https://doi.org/10.2139/ssrn.4658023
Richardson, A.D., Hufkens, K., Milliman, T., Aubrecht, D.M., Chen, M., Gray, J.M., Johnston, M.R., Keenan, T.F., Klosterman, S.T., Kosmala, M., Melaas, E.K., Friedl, M.A., Frolking, S., 2018. Tracking vegetation phenology across diverse North American biomes using PhenoCam imagery. Scientific Data 5, 180028. https://doi.org/10.1038/sdata.2018.28
Richardson, A.D., Keenan, T.F., Migliavacca, M., Ryu, Y., Sonnentag, O., Toomey, M., 2013. Climate change, phenology, and phenological control of vegetation feedbacks to the climate system. Agricultural and Forest Meteorology 169, 156–173. https://doi.org/10.1016/j.agrformet.2012.09.012
Skoković, D., Sobrino, J.A., Jiménez, J.C., Sòria, G., Julien, Y., Gomis-Cebolla, J., García-Monteiro, S., 2018. Vicarious Calibration of Landsat-8 Thermal Data Collections and its Influence on Split-Window Algorithm Validation, in: IGARSS 2018 – 2018 IEEE International Geoscience and Remote Sensing Symposium. Presented at the IGARSS 2018 – 2018 IEEE International Geoscience and Remote Sensing Symposium, Valencia, Spain, pp. 4312–4315. https://doi.org/10.1109/IGARSS.2018.8517541
Skoković, D., Sobrino, J.A., Jiménez-Muñoz, J.C., 2017. Vicarious Calibration of the Landsat 7 Thermal Infrared Band and LST Algorithm Validation of the ETM+ Instrument Using Three Global Atmospheric Profiles. IEEE Transactions on Geoscience and Remote Sensing 55, 1804–1811. https://doi.org/10.1109/TGRS.2016.2633810
Skokovic, D., Sobrino, J.A., Salinas, D., Llorens, R., Sòria, G., Jiménez, J.C., Yves, J., García-Monteiro, S., Franch, B., 2022. Validación del algoritmo Split Windows de MODIS sobre la estación de Fuente Duque en Doñana, in: Teledetección Para Una Agricultura Sostenible En La Era Del Big Data. XIX Congreso de La Asociación Española de Teledetección. Pamplona, Spain, pp. 481–484.
Sobrino, J.A., LI, Z.-L., STOLL, M.P., BECKER, F., 1996. Multi-channel and multi-angle algorithms for estimating sea and land surface temperature with ATSR data. International Journal of Remote Sensing 17, 2089–2114. https://doi.org/10.1080/01431169608948760
Sobrino, J.A., Skoković, D., 2016. Permanent Stations for Calibration/Validation of Thermal Sensors over Spain. Data 1, 10. https://doi.org/10.3390/data1020010
Sobrino, J.A., Skoković, D., Jiménez-Muñoz, J.C., 2015. Spatial analysis of the homogeneity of the land surface temperature in three Spanish test sites. International Journal of Remote Sensing 36, 4793–4807. https://doi.org/10.1080/01431161.2015.1055611
Spinosa, A., Fuentes-Monjaraz, M.A., El Serafy, G., 2023. Assessing the Use of Sentinel-2 Data for Spatio-Temporal Upscaling of Flux Tower Gross Primary Productivity Measurements. Remote Sensing 15, 562. https://doi.org/10.3390/rs15030562
Stall, S., Yarmey, L., Cutcher-Gershenfeld, J., Hanson, B., Lehnert, K., Nosek, B., Parsons, M., Robinson, E., Wyborn, L., 2019. Make scientific data FAIR. Nature 570, 27–29. https://doi.org/10.1038/d41586-019-01720-7
Sterckx, S., Brown, I., Kääb, A., Krol, M., Morrow, R., Veefkind, P., Boersma, K.F., De Mazière, M., Fox, N., Thorne, P., 2020. Towards a European Cal/Val service for earth observation. International Journal of Remote Sensing 41, 4496–4511. https://doi.org/10.1080/01431161.2020.1718240
Tanis, C.M., Peltoniemi, M., Linkosalmi, M., Aurela, M., Böttcher, K., Manninen, T., Arslan, A.N., 2018. A System for Acquisition, Processing and Visualization of Image Time Series from Multiple Camera Networks. Data 3, 23. https://doi.org/10.3390/data3030023
Templ, B., Koch, E., Bolmgren, K., Ungersböck, M., Paul, A., Scheifinger, H., Rutishauser, T., Busto, M., Chmielewski, F.-M., Hájková, L., Hodzić, S., Kaspar, F., Pietragalla, B., Romero-Fresneda, R., Tolvanen, A., Vučetič, V., Zimmermann, K., Zust, A., 2018. Pan European Phenological database (PEP725): a single point of access for European data. Int J Biometeorol 62, 1109–1113. https://doi.org/10.1007/s00484-018-1512-8
Tian, F., Cai, Z., Jin, H., Hufkens, K., Scheifinger, H., Tagesson, T., Smets, B., Van Hoolst, R., Bonte, K., Ivits, E., Tong, X., Ardö, J., Eklundh, L., 2021. Calibrating vegetation phenology from Sentinel-2 using eddy covariance, PhenoCam, and PEP725 networks across Europe. Remote Sensing of Environment 260, 112456. https://doi.org/10.1016/j.rse.2021.112456
Tso, C.-H.M., Lowther, A., Monteith, D., Flynn Banin, L., Simm, W., Rennie, S., Hollaway, M., Henrys, P., Killick, R., Watkins, J., Blair, G.S., 2021. Integration of long-term collocated ecological datasets: examples from the UK Environmental Change Network (ECN) EGU21-2293. https://doi.org/10.5194/egusphere-egu21-2293
Wohner, C., Oggioni, A., Tagliolato, P., Taubert, F., Banitz, T., Venier, S., Trembath, P., Peterseil, J., 2024. eLTER and its role of providing in-situ data to large scale research projects for modelling biodiversity dynamics (No. EGU24-1555). Presented at the EGU24, Copernicus Meetings. https://doi.org/10.5194/egusphere-egu24-1555
Wu, C., Peng, D., Soudani, K., Siebicke, L., Gough, C.M., Arain, M.A., Bohrer, G., Lafleur, P.M., Peichl, M., Gonsamo, A., Xu, S., Fang, B., Ge, Q., 2017. Land surface phenology derived from normalized difference vegetation index (NDVI) at global FLUXNET sites. Agricultural and Forest Meteorology 233, 171–182. https://doi.org/10.1016/j.agrformet.2016.11.193
Wu, Q., 2020. geemap: A Python package for interactive mapping with Google Earth Engine. Journal of Open Source Software 5, 2305. https://doi.org/10.21105/joss.02305
Xu, H., 2006. Modification of normalised difference water index (NDWI) to enhance open water features in remotely sensed imagery. International Journal of Remote Sensing 27, 3025–3033. https://doi.org/10.1080/01431160600589179
Ye, Y., Zhang, X., Shen, Y., Wang, J., Crimmins, T., Scheifinger, H., 2022. An optimal method for validating satellite-derived land surface phenology using in-situ observations from national phenology networks. ISPRS Journal of Photogrammetry and Remote Sensing 194, 74–90. https://doi.org/10.1016/j.isprsjprs.2022.09.018
Zacharias, S., Bogena, H., Samaniego, L., Mauder, M., Fuß, R., Pütz, T., Frenzel, M., Schwank, M., Baessler, C., Butterbach-Bahl, K., Bens, O., Borg, E., Brauer, A., Dietrich, P., Hajnsek, I., Helle, G., Kiese, R., Kunstmann, H., Klotz, S., Munch, J.C., Papen, H., Priesack, E., Schmid, H.P., Steinbrecher, R., Rosenbaum, U., Teutsch, G., Vereecken, H., 2011. A Network of Terrestrial Environmental Observatories in Germany. https://doi.org/10.2136/vzj2010.0139
Publisher’s Note
The statements, opinions, and data contained in all publications are solely those of the individual author(s) and contributor(s) and not of Recent Advances S.L. and/or the editor(s). Recent Advances S. L. and/or the editor(s) disclaim responsibility for any injury to people or property resulting from any ideas, methods, instructions, or products referred to in the content.
Appendix
Appendix contains supplementary material including tables S1 and S2 with calculated MAE and bias for phenology metrics comparison.
Table 3. MAE values (days) for the calculated phenology metrics from remote sensing images versus the ones calculated with in-situ phenocams. Values are provided by land cover class and method used for the retrieval of every metric. ND indicates no data available for the validation. Sample size varies from 3 to 6 dates for every comparison.


Table 4. Bias values for the calculated phenology metrics from remote sensing images versus the ones calculated with in-situ phenocams. Values are provided by land cover class and method used for the retrieval of every metric. ND indicates no data available for the validation. Sample size varies from 3 to 6 dates for every comparison.


Table 5. In situ Emissivity (e) and Land Surface Temperature values calculated with the TES method for the Fuenteduque in situ Doñana site. Land cover type is also indicated for every measurement date.

