


Terrestrial Ecosystem Integrity and Change Trends in the Yellow River Basin
Xiaoyu Zhang
1,2,Lei Feng
3,Hong Zeng
1,Ruijin Li
1,3,Menggenxikexierge Cairibujiafu
1,Zeyuan Wang
2,Lizhen Cui
4,Yuzhen Xing
1,Zongsong Wang
2,Zelin Zhang
2,Ronghai Hu

1,3,5*, 
Xiaoning Song
1,3,Kai Xue
1,3,Yanfen Wang
1,3- College of Resource and Environment, University of Chinese Academy of Sciences, Beijing, 100049, China.
- College of Life Sciences, University of Chinese Academy of Sciences, Beijing, 100049, China.
- Beijing Yanshan Earth Critical Zone National Research Station, University of Chinese Academy of Sciences, Beijing, 101408, China.
- Institute of Ecological Conservation and Restoration, Chinese Academy of Forestry, Beijing, 100091, China.
- National Key Laboratory of Earth System Numerical Modeling and Application, University of Chinese Academy of Sciences, Beijing, 101408, China.
* Author to whom correspondence should be addressed.


Abstract
Terrestrial ecosystems integrity (TEI), which reflects the capacity of ecosystems to maintain structural and functional stability under external disturbances, is a critical concept for guiding ecosystem conservation, restoration, and service valuation. However, a unified evaluation framework for terrestrial ecosystems integrity remains lacking. Existing studies on ecosystem integrity within the Yellow River Basin have predominantly focused on specific regions, with limited basin-wide assessments and insufficient integration of ecosystem structure, function, and processes. To bridge these gaps, this study developed an a comprehensive TEI evaluation system and evaluated the spatiotemporal patterns of TEI for the Yellow River Basin from 2000 to 2020, utilizing remote sensing imagery and statistical yearbooks as primary data sources. The index system incorporates seven key indicators including Splitting Index, Landscape Shape Index, GDP Per Capita and four others, utilizing remote sensing imagery and statistical yearbooks as primary data sources. Results revealed significant spatial heterogeneity in TEI, with a "high in the south, low in the north" pattern. Between 2000 and 2020, the overall TEI of the basin exhibited a polarization trend, with the most severe decline observed in the Inner Mongolia Autonomous Region. This study provides a novel framework for assessing TEI and provides a scientific foundation for informed ecosystem management strategies within the region in the Yellow River Basin.Keywords
Ecosystem, The Yellow River Basin, Terrestrial Ecosystem Integrity1. Introduction
Anthropogenic disturbances driven by population growth and technological advancements have profoundly altered natural ecosystems, leading to persistent modifications in their structural and functional attributes (Birch, 2014). Over the past few decades, increasing recognition of these transformations has fostered efforts to protect, manage, and restore ecosystems. Within the framework of integrated ecosystem management, the preservation of ecosystem integrity has emerged as a fundamental principle in natural resource governance and environmental conservation.
The concept of ecosystem integrity was initially introduced in Leopold’s Land Ethics, though its definition was not explicitly articulated (Leopoldo, 1949). It was not until 1981 that Karr (1981) conceptualized ecological integrity as the synthesis of chemical, physical, and biological integrity, positing that an intact ecosystem possesses the capacity to withstand and recover from both natural disturbances and anthropogenic impacts (Karr, 1981). Since then, scholars have continually refined and expanded this concept. In 2000, the Canadian National Parks Act legally defined ecosystem integrity as: “Ecological integrity refers to the condition of a park that is characteristic of its natural region and likely to persist, encompassing abiotic components, the composition and abundance of native species, biological communities, rates of change, and supporting processes.” Similarly, Andreasen et al. (2001) asserted that ecosystem integrity is maintained when an ecosystem sustains its structural and functional complexity, self-organizing capacity, and biodiversity despite long-term natural and anthropogenic influences.
At the landscape scale, terrestrial ecosystem integrity is often characterized by heterogeneous yet interconnected ecological structures, with the capacity to regulate energy fluxes, material cycling, and hydrological processes (Zhang et al., 2005). Such attributes enable ecosystems to resist external perturbations and promote self-recovery mechanisms. A robust assessment of ecosystem integrity necessitates the selection of key indicators that effectively capture structural, functional, and process-related attributes. These indicators are subsequently quantified and synthesized using statistical methodologies to generate comprehensive evaluations (Lin, 2019; Deng, 2020; Grantham et al., 2020; Liu, 2021; Shi and Wang, 2023). Globally, the significance of ecosystem integrity has been underscored in legislative frameworks such as the Clean Water Act (1972) in the United States and the National Parks Act (1988) in Canada, both of which prioritize the protection of ecological integrity (Fraser et al., 2009). In China, policy documents governing national parks explicitly emphasize the conservation of ecosystem authenticity and integrity. The spatiotemporal analysis of ecosystem integrity patterns and trends plays a pivotal role in refining environmental protection strategies and providing a scientific foundation for sustainable socio-economic development within river basins.
Originating from the northern foothills of the Bayan Kara Mountains on the Qinghai-Tibet Plateau, the Yellow River Basin (YRB) is one of China’s most ecologically fragile regions due to its climatic and geographical conditions. The basin faces pressing environmental challenges, including vegetation degradation, land desertification, soil erosion, and hydrological alterations (Liang et al., 2022). Additionally, the YRB ecosystem plays a vital role in sustaining ecosystem services, with its total ecosystem service value estimated at ¥2559.82 billion (2020)—equivalent to 100.08% of the basin’s total GDP for that year (Qing et al., 2022). Maintaining the ecological stability and service functionality of the YRB is therefore of critical importance.
A comprehensive assessment of the YRB’s capacity to sustain ecological processes and ecosystem services necessitates the selection and quantification of key indicators that encapsulate ecosystem structure, function, and process dynamics (Guo et al., 2022; Lin and Zhao, 2022; Zhang et al., 2022; Zhu et al., 2022). However, existing research primarily aims to inform decision-makers at the administrative or reserve level, leading to regionally fragmented assessments that focus on localized ecological health (Li et al., 2018; Zuo et al., 2020; Chen et al., 2023; Shen et al., 2023; Guo et al., 2024), ecosystem quality (Ji et al., 2021; Song et al., 2021; Cao et al., 2023), or service provisioning (Fang et al., 2021; Yang et al., 2021; Zhang et al., 2021a; Zhang et al., 2021b; Zhang et al., 2022; Zhang et al., 2023). As a result, a standardized and integrated framework for evaluating ecosystem integrity at the basin scale remains elusive. A holistic assessment of YRB ecosystem integrity should prioritize basin-wide ecological coherence while systematically evaluating the structural, functional, and process-based attributes of the terrestrial ecosystem.
This study aims to develop a comprehensive indicator system for assessing the integrity of terrestrial ecosystems across the Yellow River Basin. The study systematically quantifies key ecological indicators, conducts a basin-wide evaluation of ecosystem integrity, and examines its spatiotemporal dynamics from 2000 to 2020. By integrating geospatial analysis and statistical modeling, this study provides a scientific foundation for the dynamic monitoring and evaluation of ecosystem integrity. Furthermore, the findings offer critical insights for the delineation and optimization of ecological protection zones—including ecological red lines, nature reserves, and national parks—within the Yellow River Basin, thereby contributing to evidence-based ecosystem management and conservation planning.
2. Materials and Methods
2. 1 Study Area
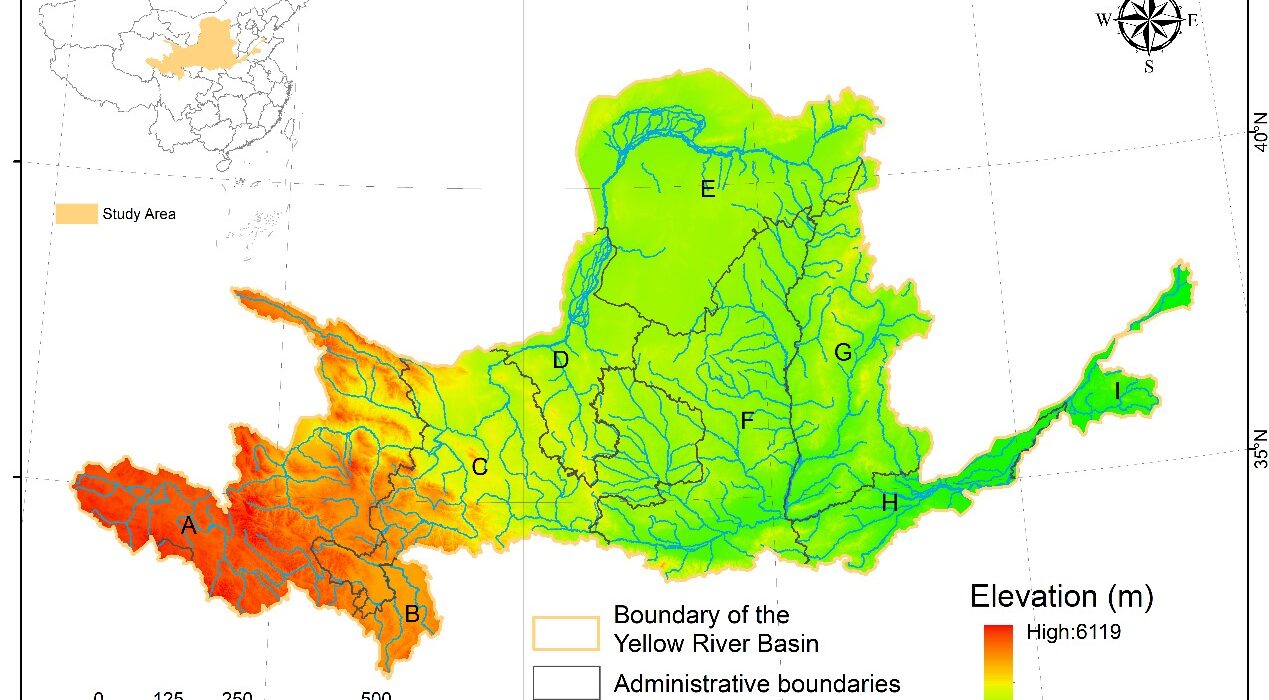
The Yellow River, China’s second-longest river, originates from the northern foothills of the Bayan Kara Mountains on the Qinghai-Tibet Plateau (Fig. 1) and traverses nine provinces: Qinghai, Sichuan, Gansu, Ningxia, Inner Mongolia, Shaanxi, Shanxi, Henan, and Shandong, before discharging into the Bohai Sea at Dongying, Shandong Province (Fig. 1). The basin spans 96°–119° E and 32°–42° N, encompassing a total area of 795,000 km², including 42,000 km² of endorheic (internally drained) river systems. The upper–middle reaches are demarcated at Hukou Town, Tuoketuo County, Inner Mongolia Autonomous Region (41°16′ N, 111°9′ E), while the middle–lower reaches transition at Taohuayu, Zhengzhou City, Henan Province (34°58′ N, 113°30′ E).
The Yellow River Basin exhibits a pronounced altitudinal gradient, with elevations decreasing from west to east. The upstream region, located on the Qinghai-Tibet Plateau, has an average elevation exceeding 4,000 meters, while the middle reaches traverse the Loess Plateau, characterized by elevations ranging from 1,000 to 2,000 meters. The downstream region consists of a coastal alluvial plain, with elevations generally below 1,000 meters.
Climatically, the basin spans multiple biogeographic zones, including the plateau subarctic zone, temperate zone, and warm temperate zone, resulting in distinct ecological characteristics across different reaches. Vegetation distribution exhibits altitudinal and climatic zonation: the upstream region is dominated by alpine meadows and cold-temperate grasslands, while the middle reaches feature temperate steppe, shrublands, and fragmented forests. The downstream region, influenced by a humid temperate climate, supports mixed coniferous-broadleaf forests and riparian wetlands.
Precipitation within the Yellow River Basin is highly seasonal and unevenly distributed, with substantial interannual variability. The combination of natural hydrological constraints and unsustainable water resource exploitation has exacerbated ecological fragility in the basin. Major environmental challenges include declining runoff, hydrological alterations, severe water pollution, intensified soil erosion, desertification, and vegetation degradation (Pan, 2021).
To mitigate these environmental pressures, a series of ecological restoration and conservation initiatives have been implemented over the past few decades:
Upper and Middle Reaches (Qinghai, Inner Mongolia, Gansu, Shaanxi): (1) Grassland restoration programs to enhance water conservation capacity; (2) Reforestation and afforestation efforts, including the Grain for Green Program (GFGP) and the Three-North Shelter Forest Program, aimed at controlling desertification and reducing soil erosion; (3) Establishment of protected areas, such as the Sanjiangyuan National Park, to preserve critical headwater ecosystems.
Middle Reaches (Loess Plateau, Shaanxi, Shanxi, Ningxia): (1) Conversion of sloping farmland into forests and grasslands to improve soil and water conservation; (2) Implementation of soil erosion control measures, including terracing and check-dam construction.
Lower Reaches (Henan, Shandong): (1) Riparian and wetland restoration, including the reconnection of isolated water bodies to river channels and conversion of agricultural land into wetlands; (2) Establishment of the Yellow River Estuary National Park for wetland conservation and biodiversity protection; (3) Construction of green ecological corridors to enhance landscape connectivity and ecosystem resilience.
The significant elevation difference from west to east in the Yellow River Basin has created diverse habitats, supporting a high level of species diversity. This is conducive to the overall structural and functional complexity of the Yellow River Basin’s ecosystem and helps maintain the integrity of its ecosystem better when disturbed by human activities. However, at the same time, this large altitude gradient causes the river to have a huge gravitational potential energy. The middle reaches pass through the loose loess Plateau. The combination of loose loess parent material, concentrated heavy rain and steep terrain makes soil erosion in this area relatively serious, reduces soil fertility, further reduces the productivity of vegetation and destroys the composition of the ecosystem. Such significant elevation differences are often accompanied by deep canyons, steep ridges and complex terrains, as well as considerable climatic variations over short distances (such as on both sides of steep ridges), which create smaller and more scattered habitat patches at the microscopic scale. The structural fragmentation of this landscape structure leads to the isolation of populations within the basin and the disruption of the integrity of the ecosystem. Therefore, the significant elevation difference from west to east in the Yellow River Basin has a dual impact on the integrity of the ecosystem: On the one hand, it serves as the structural foundation for maintaining biodiversity and complex ecological functions at the macroscopic scale; On the other hand, it can also be a potential cause for the intensification of habitat fragmentation and the obstruction of ecological process connectivity at the micro scale.


Figure 1. Topographic and Provincial Administrative Division Map of the Yellow River Basin (A: Henan Province; B: Inner Mongolia Autonomous Region; C: Ningxia Hui Autonomous Region; D: Qinghai Province; E: Shandong Province; F: Shanxi Province; G: Shaanxi Province; H: Sichuan Province).
Assessing the integrity of terrestrial ecosystems within the Yellow River Basin is essential for informing future conservation strategies and policy implementation, particularly in guiding the zoning and establishment of national parks across distinct ecological subregions. A systematic evaluation of ecosystem integrity can provide scientific evidence for adaptive management approaches, ensuring long-term ecological sustainability within the basin.
2.2. Framework for Evaluation of Ecological Integrity
The establishment of an evaluation index system for ecosystem integrity is pivotal to selecting appropriate indicators and determining evaluation criteria (Huang et al., 2006; Lin, 2019; Deng, 2020). Currently, numerous index systems and standards exist, which necessitates the development of a comprehensive evaluation framework that is tailored to the unique characteristics of the Yellow River Basin (Jiang et al., 2018; Grantham et al., 2020; Ma et al., 2022; Chauvenet, 2023).
The main difference in the integrity evaluation between aquatic ecosystems and terrestrial ecosystems lies in the different assessment elements and data acquisition methods. The assessment of the former mainly selects water quality parameters (such as dissolved oxygen content in water, inorganic salt concentration, pollutant concentration, etc.) and the species and biological density data of aquatic organisms sensitive to water environment changes (invertebrates, algae, fish, etc.) as the core elements of the assessment(Li et al., 2018; Grabas et al., 2012; Smogor and Angermeier, 2020). The latter (the integrity of terrestrial ecosystems) takes relevant data on habitat, soil, biodiversity and the growth of vegetation as assessment elements (Grantham et al., 2020; Ma et al., 2022; Chauvenet, 2023). Meanwhile, due to the physical properties of water (specular reflection of electromagnetic waves), it is difficult to extract relevant data from remote sensing images of water areas that can reflect the aquatic ecosystem of that water area. However, there are obvious data differences between specific band remote sensing images of terrestrial ecosystems in different states. Utilizing remote sensing image data to reflect the characteristics of terrestrial ecosystems has become a relatively commonly used technology(Grantham et al., 2020; Lin, 2019; Manolaki et al., 2021). As the water conservation and soil and water conservation services provided by the terrestrial ecosystem are important factors for the ecological value of the Yellow River and also the direct targets of human measures to protect the ecological environment of the basin, and considering the availability of research data, we evaluate the integrity of the terrestrial ecosystem in the Yellow River Basin.
Ecosystems are inherently dissipative structures, as defined by dissipative structure theory (Wu, 1991). In the absence of external disturbances, a self-organizing dissipative system, such as an ecosystem, increases its dissipation and consequently enhances its energy capture capacity (e.g., photosynthesis), respiration, and transpiration (Schneider and Kay, 1994). Simultaneously, the paths of material and energy fluxes become more complex, leading to increased biodiversity and biomass. These processes are intrinsically tied to the integrity of ecosystem components (e.g., biological, physical, and chemical compositions) and ecological processes (e.g., ecosystem functions). Evaluating ecosystem integrity requires not only integrating ecological indicators but also considering anthropogenic pressure indicators to reflect the degree of ecosystem change under human influence (Jiang et al., 2018; Lin, 2019; Grantham et al., 2020; Manolaki et al., 2021).
The choice of evaluation indicators varies depending on the focus and interpretation of ecosystem integrity by different scholars. Commonly used indicators include:
Indicator Species Index: This method identifies species that are particularly representative of ecosystem characteristics in the study area, such as fish and algae in aquatic ecosystems (Ahn et al., 2011; Grabas et al., 2012; Li et al., 2018; Smogor and Angermeier, 2020), or birds in wetlands (Veselka et al., 2010; Bochio and Anjos, 2012; Chin et al., 2015). After identifying these indicator species, evaluations are carried out at both the individual and population levels, utilizing specific metrics like the Biological Integrity Index and Terrestrial Biological Integrity Index.
Pressure-Related Indicators: These indicators encompass the human-induced stressors affecting ecosystem quality, such as resource exploitation and waste discharge. These pressures lead to alterations in ecosystem composition and ecological processes, thus impacting overall ecosystem integrity (Özkundakci et al., 2014; Fernandes et al., 2019a; Fernandes et al., 2019b). Typical pressure indicators include temperature, toxic pollutants, pH, population density, land use patterns, and per capita GDP (Fraser et al., 2009).
Structure-Function-Composition Indicators: This set of indicators covers three critical levels of ecosystem organization: structure, function, and composition. Structural indicators include spatial heterogeneity, patch size, and soil conditions (Zhang et al., 2005). Functional indicators capture ecosystem processes, such as biomass production, primary productivity, and patch connectivity. Composition indicators include vegetation coverage, species abundance, and patch type richness.
Upon reviewing the relevant literature and drawing from the foundational principles of ecosystem integrity, this study establishes a multi-dimensional index system based on the composition, structure, function, and anthropogenic pressures that define the ecosystem dynamics in the Yellow River Basin (Lin, 2019; Grantham et al., 2020; Liu, 2021; Ma et al., 2022; Shi and Wang, 2023). The structure-function-composition framework is particularly suited for this basin for several reasons:
Human-Nature Interactions: The Yellow River Basin is home to approximately 120 million people and has rich mineral resources, especially in the coal industry. As such, anthropogenic impacts, including resource extraction and urbanization, must be considered when evaluating ecosystem integrity. The chosen functional indicators help assess the ecosystem’s resilience and capacity for self-regulation under human influence, as well as its ability to maintain ecological balance despite human interference.
Data Availability and Practical Application: The structure-function-composition index system allows for the use of landscape data and remote sensing imagery, which are particularly advantageous when evaluating large-scale regions. These data sources mitigate the labor-intensive processes of species selection and high-precision field surveys, providing a more feasible and scalable approach to ecosystem evaluation.
Hierarchical Structure of Evaluation: In comparison to the Pressure-State-Response (PSR) model, the structure-function-composition framework offers clearer hierarchical distinctions between ecosystem components, facilitating more accurate and applicable assessments in natural environments, beyond the controlled conditions of laboratory settings.
Integration of Anthropogenic Stress: While the structure-function-composition framework does not directly reflect anthropogenic stress, this study integrates pressure-related indicators from the PSR model to complement the evaluation. This ensures that both current and future ecosystem integrity are assessed, accounting for both natural and human-induced factors.
Based on the principles outlined above, the final evaluation index system for the Yellow River Basin consists of two levels of indicators: These include indicators for ecosystem structure, function, composition, and anthropogenic pressures.
These are detailed according to the first-level categories: Structure: Splitting Index, Largest Patch Index; Function: Landscape Shape Index; Composition: Vegetation Coverage (reflecting regional vegetation growth) and Shannon Diversity Index (reflecting landscape heterogeneity); Anthropogenic Pressure: Population Density and Per Capita GDP (reflecting human interference).
These selected indicators provide a comprehensive and nuanced assessment of the terrestrial ecosystem integrity in the Yellow River Basin, addressing both ecological dynamics and anthropogenic pressures (Table 1).
Table 1. TEI evaluation indices
| Primary Indicators | Secondary Indicators | Description |
| Ecosystem structure | Division Index Largest Patch Index | Reflecting the degree of patch fragmentation Reflecting the size of the habitat provided within the patch |
| Ecosystem function | Landscape Shape Index Soil Erosion Intensity | Reflecting the degree of patch fragmentation Reflecting the state of soil erosion |
| Ecosystem composition | Vegetation Coverage Shannon Diversity Index | Reflecting regional vegetation growth state Reflecting landscape heterogeneity |
| Human Disturbances | GDP Per Capita | Reflect the economic development of the region and the intensity of human activities |
2.3. Data
Land use data, elevation data and administrative divisions of China were provided by Data Center for Resources and Environmental Sciences, Chinese Academy of Sciences (http://www.resdc.cn/). The normalized difference vegetation index data by GEE (Google Earth Engine) platform of the normalized difference vegetation index data set (MOD13A1 data) (https://developers.google.cn/earth-engine/), Soil data was provided by Cold and Arid Regions Scientific Data Center (http://we stdc.westgis.ac.cn/). Social and economic data were from the China Urban Statistical Yearbook (2001-2021), published by the publishing house under the National Bureau of Statistics of China.
2.4. Model to Evaluate the TEI
We describe EI from four aspects, namely ecosystem structure, ecosystem function, ecosystem composition and human disturbance. On this basis, 7 secondary indices were selected to evaluate TEI.
2.4.1. Division Index
The landscape Division Index (Vi) mainly measures the degree of connectivity between different patches. A high degree of fragmentation means that the landscape composition of the corresponding area is very fragmented and the connectivity between patches is poor, which helps to comprehensively understand the overall landscape pattern of the study area, reflect the degree of landscape fragmentation, and analyze its ecological impact in depth(Wu, 2024). It is calculated by:
In the formula, aij represents the area of the j-th plaque of type i, m represents the total number of plaque types, n represents the total number of type i plaques, A represents the total area of the landscape (hm2).
2.4.2. Largest Patch Index
Largest patch index (LPI) reflects the proportion of the largest patch area within a certain type to the total area of that type. A higher LPI signifies that the largest patch area constitutes a larger proportion of the entire landscape(Wang et al., 2020. Larger patch areas can offer expanded habitat space, contribute to increased biodiversity, and provide more habitats and resources. It is calculated by
where amax represents the area of the largest patch in the landscape or a specific patch type (m2), and A represents the total area of the landscape (hm2).
2.4.3. Landscape Shape Index
Landscape shape index (LSI) reflects the complexity of patch shape, with a higher value indicating a more complex patch shape, containing more concave and convex gaps and boundary curves, resulting in a more scattered and fragmented shape, and lower habitat quality within the patch(Zhou et al., 2023. It is calculated by
where E represents the total length of all patch boundaries in the landscape, and A represents the total area of the landscape.
2.4.4. Soil Erosion Intensity
Soil erosion is the process whereby soil or parent material undergoes destruction, stripping, transportation, and deposition due to external forces. Soil erosion intensity is typically determined using the RUSLE (Revised Universal Soil Loss Equation) model. This model, an enhanced version developed by the Agricultural Research Service of the United States Department of Agriculture, is based on the USLE (Universal Soil Loss Equation) model. It is calculated by
where SL represents the soil loss, R signifies the rainfall erosivity factor, K denotes the soil erodibility factor, and L and S represent the slope length and slope steepness factors. Additionally, C represents the land cover factor, and P signifies the practice factor for soil conservation measures.
R represents the correlation between rainfall and soil erosion, serving as a crucial factor reflecting soil erosion. The R value is determined using the Wischmeier (1969) formula, and its calculation involves
where t represents the annual average precipitation.
K represents the correlation between soil texture and erodibility. For the same land use type, soils with comparable properties exhibit similar K values(Liu et al., 2014). It is calculated by
where SN, SIL, CLA, and C represent the percentages of sand, silt, clay, and organic carbon content, respectively.
The L, S factor captures the combined impact of slope length and slope steepness on soil erosion. In this case, a Digital Elevation Model (DEM) is employed as the base data to compute L and S(Deng, 2020), and their calculation involves
where λ represents the slope length, which is calculated as the product of flow accumulation and the measured size, m is a dimensionless constant that depends on the slope angle θ.
The C factor signifies the ratio of soil loss under specific vegetation cover compared to soil loss after continuous fallow land. Its determination occurs when all other soil, slope, slope length, and rainfall conditions remain constant(Cai et al., 2000). It is calculated by
where fc represents the vegetation coverage.
The P factor denotes the ratio of soil loss after implementing soil conservation measures to soil loss when vegetation is planted along the slope.
2.4.5. Vegetation Coverage
The Vegetation Coverage Index (Ci) represents the percentage of ground covered by vegetation, including leaves, stems, and branches, in a given unit area. This index reflects the density of vegetation on the ground and the size of the photosynthetic area of plants.
The Normalized Difference Vegetation Index (NDVI) is a crucial indicator representing vegetation growth, calculated by utilizing the near-infrared and red bands. It is calculated by
where NIR represents the near-infrared band, and RED represents the red light band. Vegetation coverage is calculated using the NDVI (Normalized Difference Vegetation Index) value(Mu, 2013), it is calculated by
where VCi signifies the vegetation coverage, NDVIv represents the NDVI value for the vegetation-covered portion, and NDVIs represents the NDVI value for the soil portion. Based on existing literature, this study replaces NDVIv and NDVIs with the maximum and minimum values of NDVI, respectively. Therefore:
2.4.6. Shannon Diversity Index
Shannon’s Diversity Index (SHDI) reflects the heterogeneity of the landscape and is particularly sensitive to the uneven distribution of various patch types. An increase in Shannon Diversity Index signifies a rise in patch types or a more balanced distribution of patch types in the landscape(Wang et al., 2020).
where m refers to the total number of patch types in the landscape, and PTi refers to the proportion of patch type i in the entire landscape.
2.4.7. GDP Per Capita
As a key indicator of regional economic development, GDP per capita directly reflects the average economic level of residents in a region. However, economic development often puts pressure on ecosystems indirectly. In particular, economic development usually requires the continuous development of resources, and damage to the ecological environment may occur in the process of resource development (Aras, 2020; Chen, 2020; Awan, 2022). For the underdeveloped Yellow River basin, economic development will have a certain impact on the structure and function of the ecosystem.
2.4.8. Normalization
In this study, a maximum-minimum method will be used to normalize the calculated indicators. Based on the nature of ecosystem integrity, indicators are categorized into positive and negative indicators. A comprehensive index method is then applied for evaluation.
The normalization formula for negative indicators is as follows:
where Xmax represents the maximum value, and Xmin represents the minimum value.
The normalization formula for negative indicators is as follows:
2.4.9. Index of TEI
After normalization of all indicators, we will use the following formula to calculate TEI:
where, “SPLIT”, “LPI”, “LSI”, “A”, “SHDI”, “Ci”, “GDP (per capita) ” are the seven secondary indicators mentioned above, and α, β, γ, δ, ε, ζ, η are their respective weights. These weights are determined by the weight model of yaahp (Yet Another AHP, an AHP analysis software) after experts score the importance of indicators.
2.4.10. Classification of TEI
Based on the calculation results, we categorize the TEI of the Yellow River basin into five levels: Poor (0–0.20), Fair (0.20–0.40), Average (0.40–0.60), Good (0.60–0.80), and Excellent (0.80–1.00). These sequential tiers reflect progressively higher integrity, ranging from minimally functional conditions to optimal ecosystem status. A higher calculation result for integrity reflects a higher level of integrity in the region.
3. Results
3.1. Spatial Patterns and Changes of Key Evaluation Indicators
3.1.1. Spatial Patterns and Changes of Landscape division index (Vi)
The Yellow River Basin exhibits a generally low fragmentation of landscapes, which indicates high potential for TEI preservation. Areas characterized by low Vi values are primarily found in Sichuan Province and the western Inner Mongolia Autonomous Region in the upstream basin, as well as in Henan, Shanxi, and Shandong Provinces in the middle and downstream basins (Fig. 2). These regions predominantly feature extensive forests and desert grasslands, with large, relatively undisturbed landscape patches and minimal human impact. The dominant landscape types, such as forests and desert grasslands, show strong ecological connectivity. Conversely, areas with high Vi values, such as those in Gansu, Shaanxi, and northern Shanxi Provinces, demonstrate more fragmented landscapes due to the overlapping presence of various landscape elements, which results in limited connectivity and greater landscape fragmentation. Between 2000 and 2020, Vi increased in the northern Ningxia Hui Autonomous Region and the central-western region of the Inner Mongolia Autonomous Region, while experiencing a notable decrease in the Yellow River estuary area of Shandong Province.

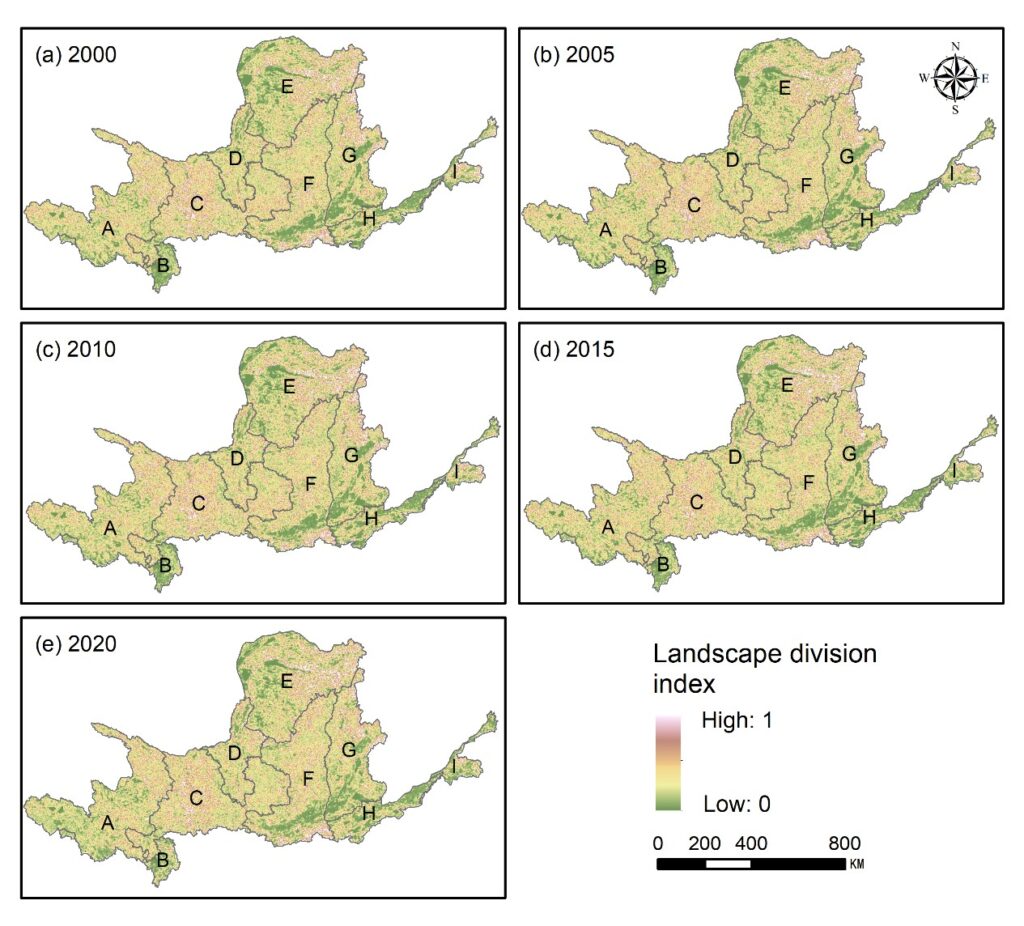
Figure 2. Spatial pattern of landscape fragmentation in the Yellow River Basin from 2000 to 2020.
3.1.2. Spatial Patterns and Changes of Vegetation Coverage
The spatial distribution of vegetation coverage within the Yellow River Basin exhibits higher values in Sichuan, southern Shaanxi, Shanxi, Henan, and Shandong Provinces (Fig. 3). Areas with very low vegetation coverage are primarily concentrated in the Loess Plateau region, including parts of Gansu, Ningxia, and northern Shaanxi Provinces. The basin’s vegetation coverage generally follows a latitudinal gradient, with higher values in the southern regions and lower values in the northern regions. Rainfall, temperature, and topography strongly influence vegetation coverage. In areas such as the northern Sichuan Basin and the mountainous regions of the middle and lower Yellow River, where rainfall is relatively abundant and temperatures are higher, forests and dense grasslands dominate, resulting in higher vegetation coverage. Between 2000 and 2020, significant improvements were observed, particularly after 2015, in vegetation coverage within the Loess Plateau region. Overall, vegetation coverage has consistently increased, with notable improvements in previously low-coverage areas, including Gansu, Ningxia, and Inner Mongolia Autonomous Region.
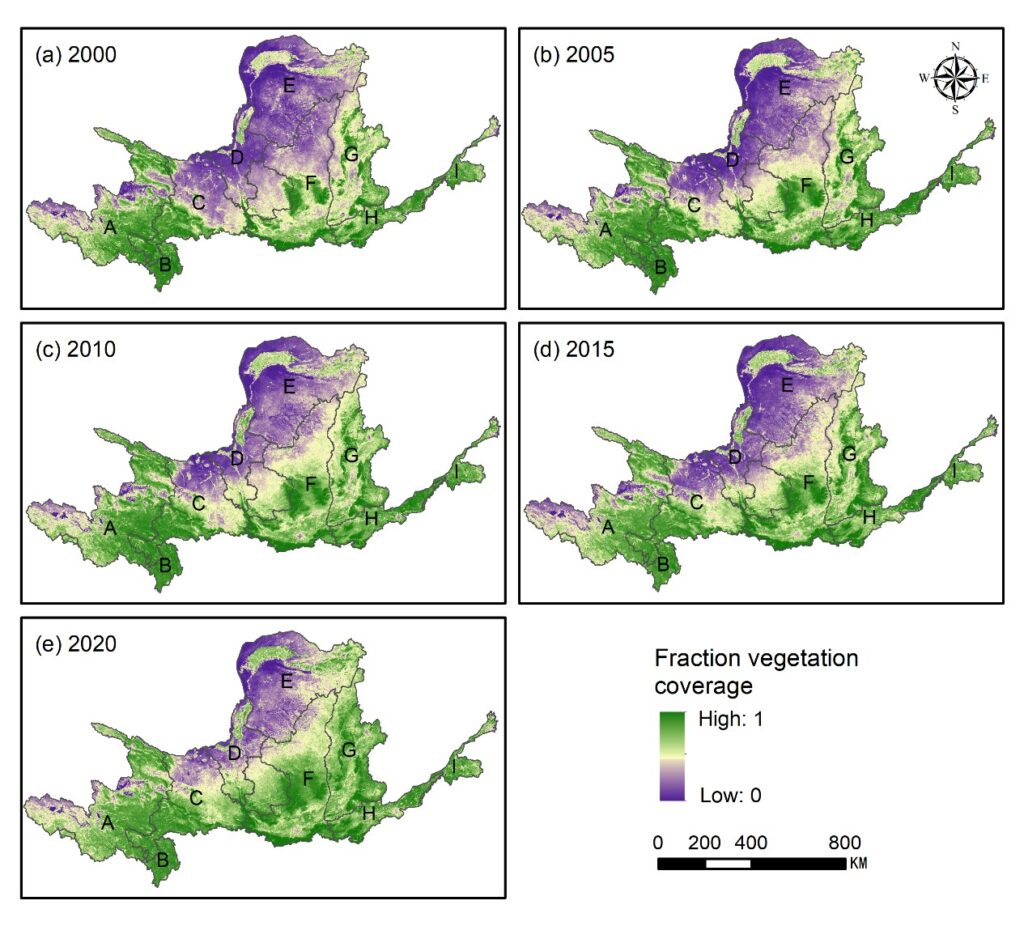
Figure 3. Spatial pattern of vegetation coverage in the Yellow River Basin from 2000 to 2020.
3.1.3. Spatial Patterns and Changes of Soil Erosion
Soil erosion intensity across the Yellow River Basin primarily falls within the medium to low range, with regions experiencing severe soil erosion concentrated in Qinghai, Inner Mongolia Autonomous Region, and Shaanxi Province (Fig. 4). High erosion intensity in Qinghai’s cold temperate coniferous forest regions and central Inner Mongolia’s grassland desertification zones is largely attributed to the presence of large rivers such as the Yalong and Min Rivers. These areas, despite substantial vegetation cover, remain highly susceptible to erosion. In the Loess Plateau, including Inner Mongolia and Shaanxi Provinces, hydraulic erosion, wind erosion, and gravity erosion all contribute to significant soil degradation, with hydraulic erosion being the predominant force. From 2000 to 2020, no significant change in soil erosion intensity was observed, although a slight overall reduction was noted.
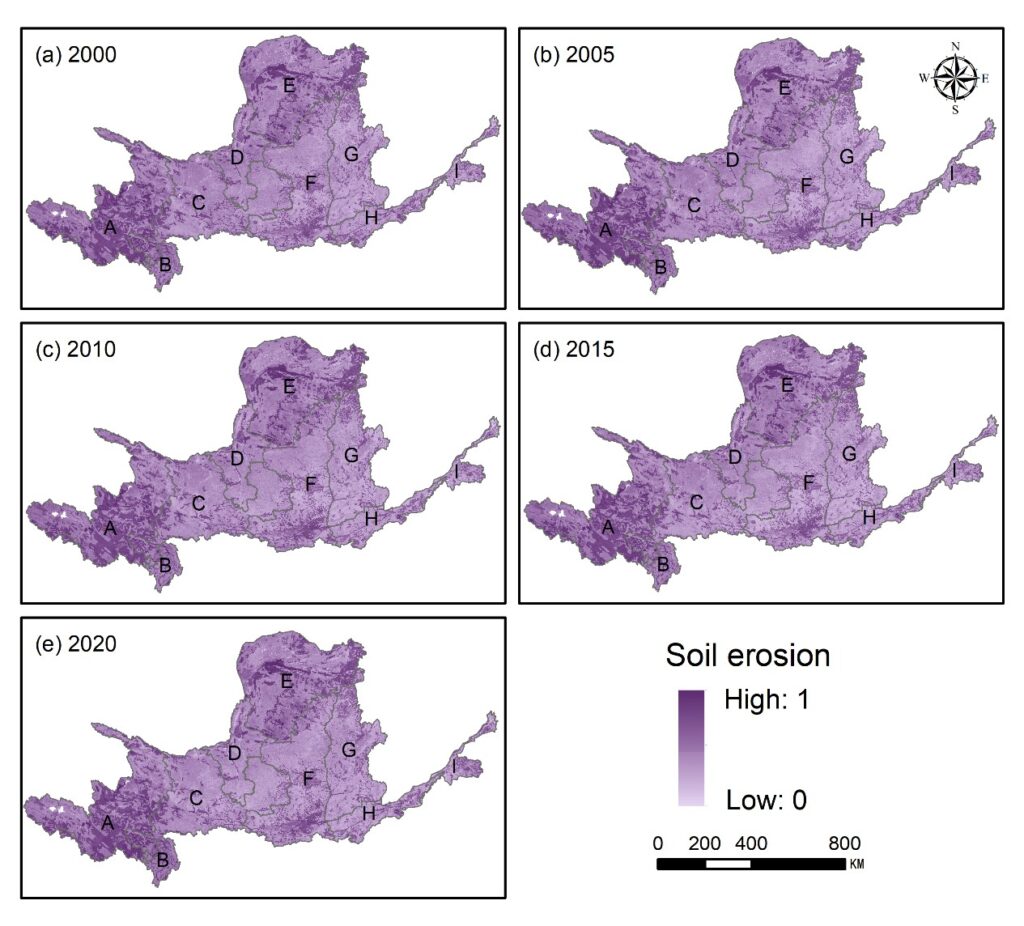
Figure 4. Spatial pattern of soil erosion in the Yellow River Basin from 2000 to 2020.
3.1.4. Spatial Patterns and Changes of the Largest Patch Index (LPI)
Analysis of the LPI spatial distribution reveals that large patches are most prevalent in the upstream basin, including Qinghai Province’s desert grasslands, the cold temperate coniferous forest regions of eastern Tibet and western Sichuan, the central desert grassland regions of Inner Mongolia Autonomous Region, the Qinling-Bashan Mountains, Yanshan Mountains, Taihang Mountains in the middle reaches, and throughout the downstream basin (Fig. 5).
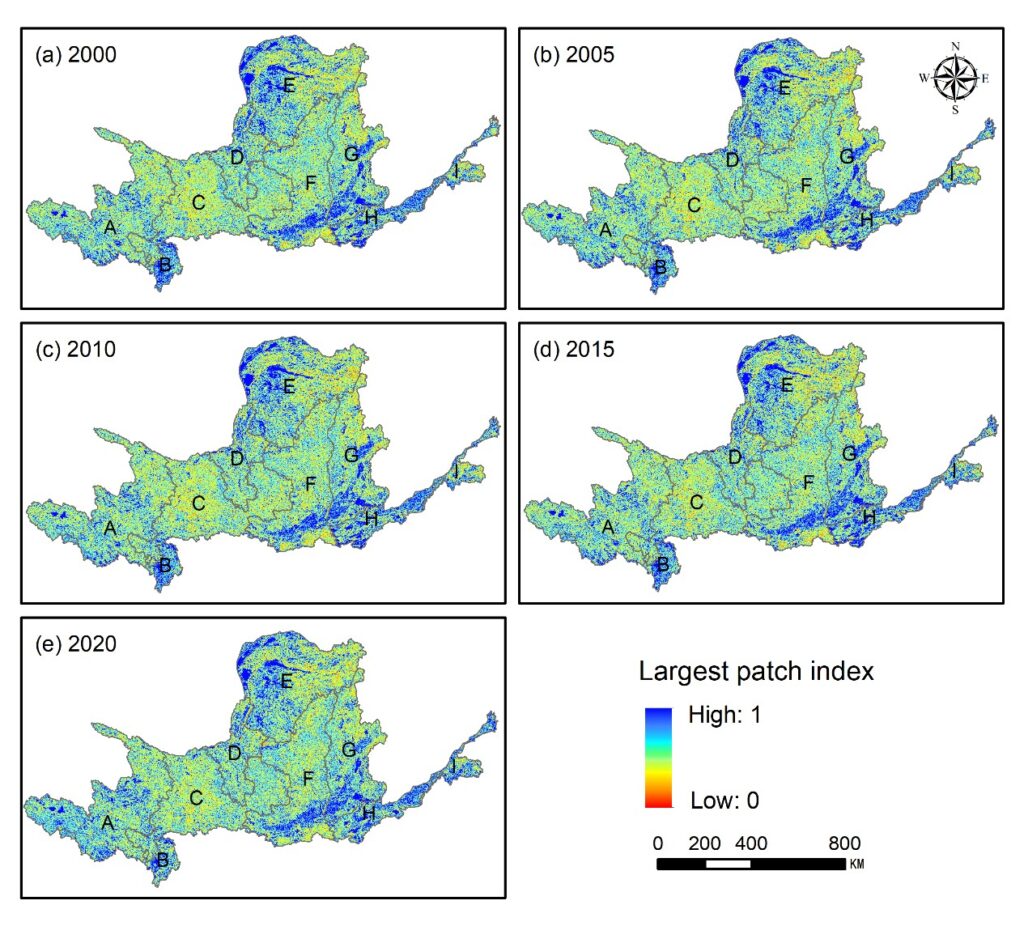
Figure 5. Spatial pattern of the LPI variation in the Yellow River Basin from 2000 to 2020.
3.1.5. Spatial Patterns and Changes of the Landscape Shape Index (LSI)
The LSI reflects the proportion of the maximum patch area within the landscape, influencing ecosystem stability and functionality (Fig. 6). Larger patches support more extensive habitats, increase biodiversity, and enhance habitat connectivity, thereby facilitating species migration and interaction. In contrast, smaller patches, as observed in Gansu and Shaanxi Provinces in the upper and middle reaches, tend to exhibit lower connectivity and reduced habitat quality. From 2000 to 2020, changes in the LSI were relatively minor, with slight decreases observed in western Sichuan and central Inner Mongolia.
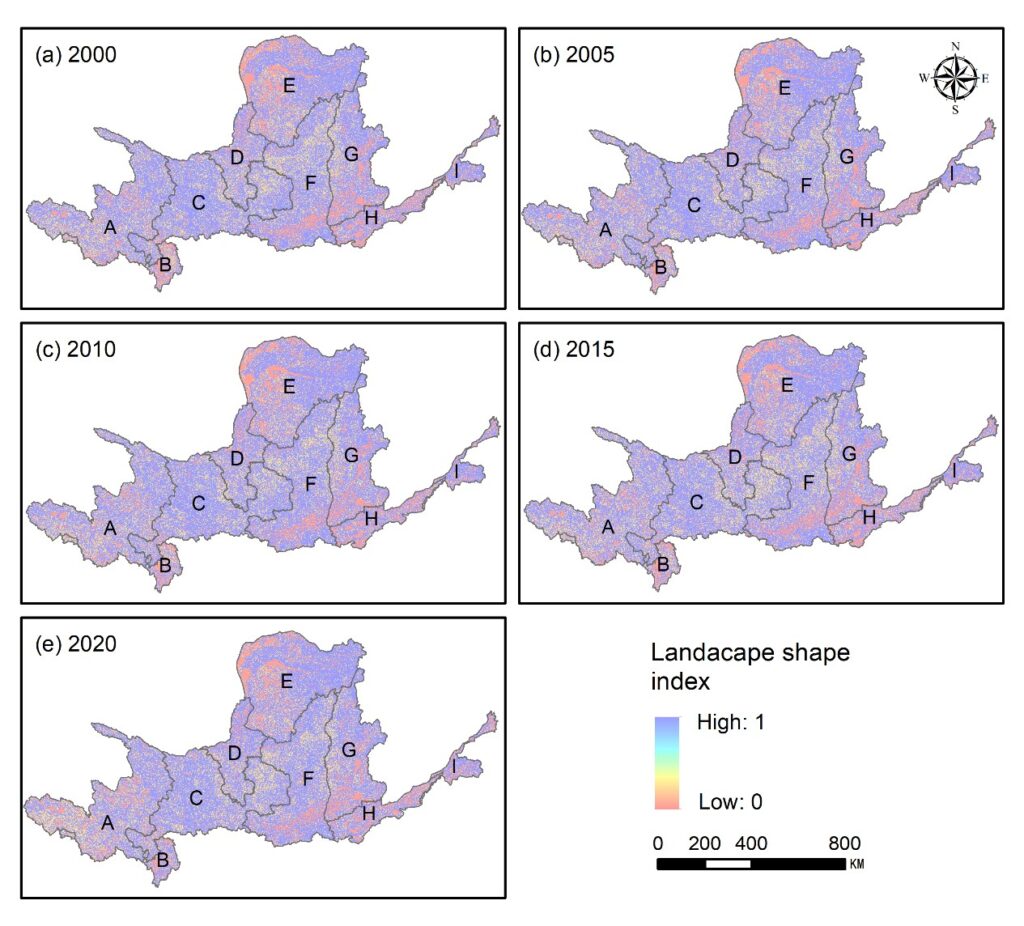
Figure 6. Spatial pattern of LSI in the Yellow River Basin from 2000 to 2020.
3.1.6. Spatial Patterns and Changes of Shannon’s Diversity Index (SHDI)
The SHDI, which quantifies species richness and evenness, is relatively high in regions such as Gansu, Shaanxi, and northern Shanxi Provinces, suggesting a more diverse and balanced ecosystem (Fig. 7). Conversely, lower SHDI values are observed in Qinghai, western Sichuan, central Inner Mongolia, Henan, and Shandong Provinces, indicating lower species diversity and equilibrium. From 2000 to 2020, the SHDI showed a slight decline in the middle and lower reaches of the Yellow River Basin.
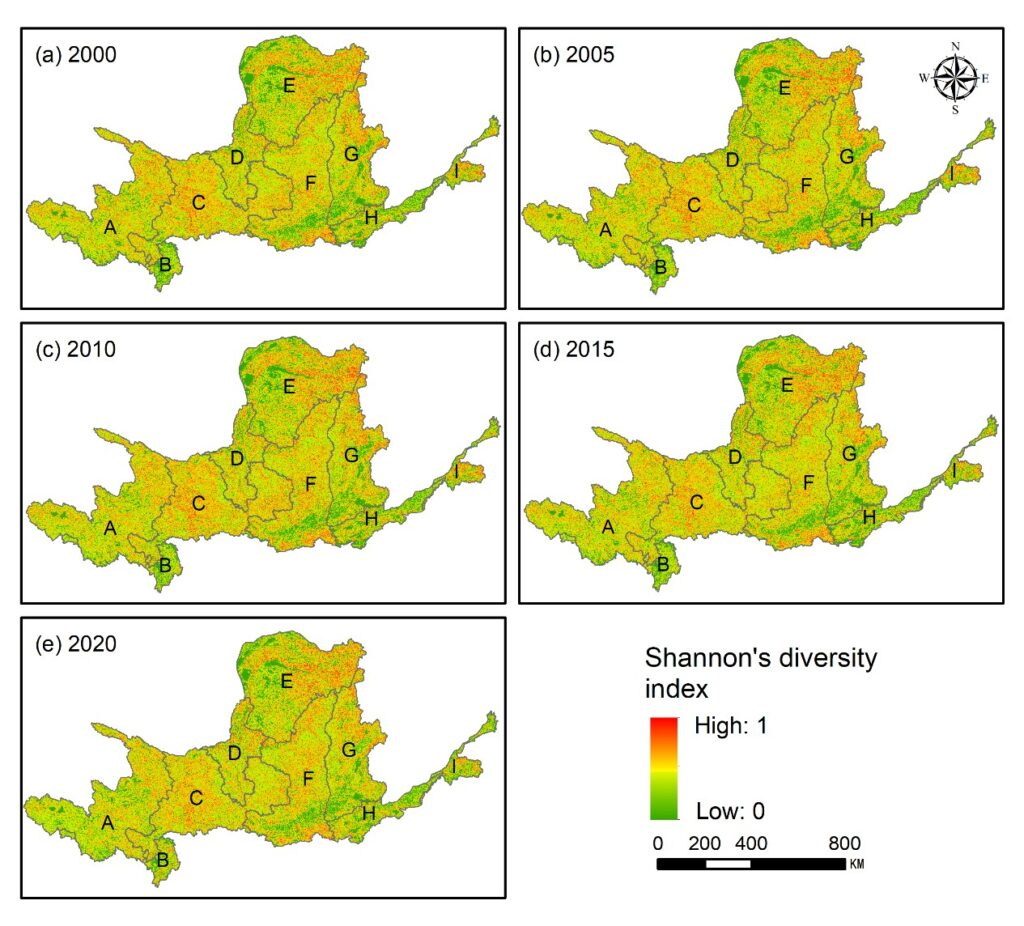
Figure 7. Spatial pattern of Shannon’s diversity index in the Yellow River Basin from 2000 to 2020.
3.1.7. Per Capita GDP Spatial Pattern and Changes
Per capita GDP across the Yellow River Basin exhibits the highest values in Ordos City, located in the Inner Mongolia Autonomous Region (Fig. 8). Regions such as Qinghai, Sichuan, and Shaanxi exhibit relatively low per capita GDP. In 2015, an area with significantly lower ecosystem integrity emerged in the northern part of the basin. The main reason was that the human disturbance index (per capita GDP) in the northern part of the basin increased sharply (Figure 8). This area is the Ordos City and its surrounding areas, and the main industries are coal mining and wool textile, which have a negative impact on the ecological environment(Li, 2021). The prosperity of this industry will lead to problems such as fragmented landscapes and soil degradation, potentially damaging the structure and function of the ecosystem and reducing its integrity. Over the period from 2000 to 2020, most areas in the basin experienced a significant increase in per capita GDP, reflecting the region’s growing economic development.
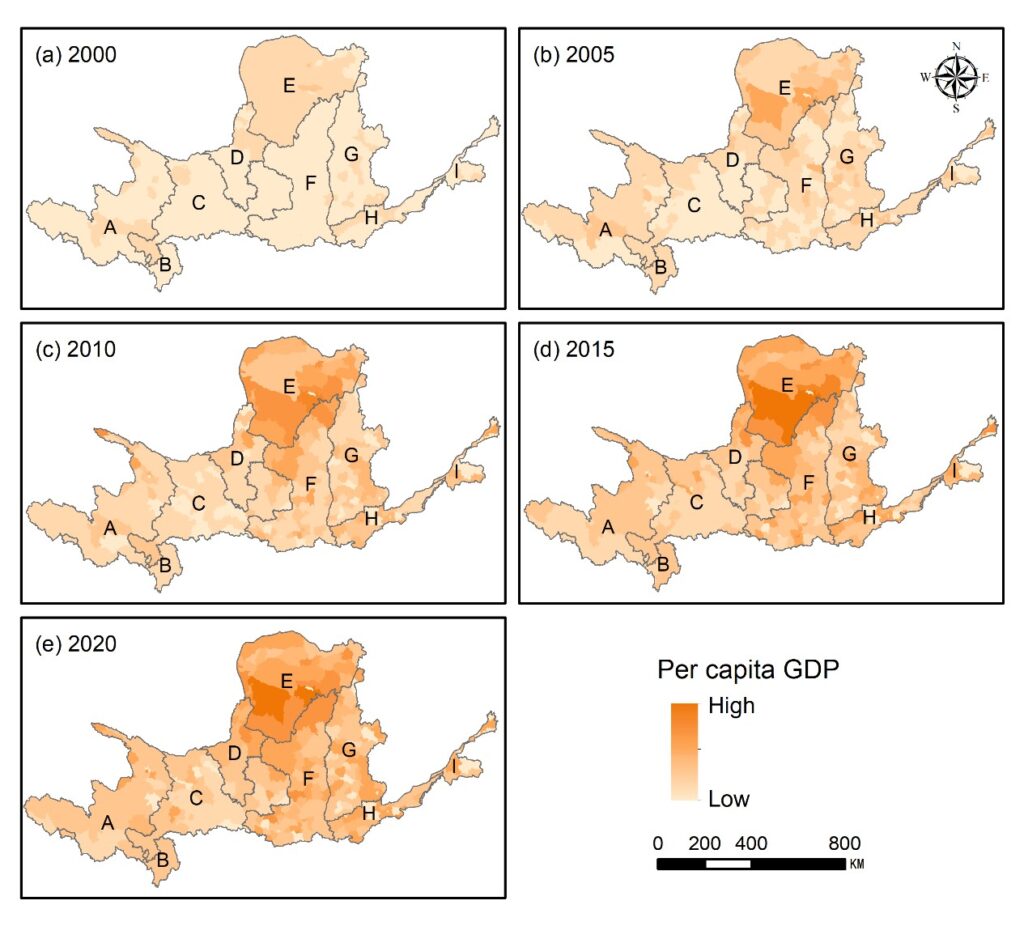
Figure 8. Per Capita GDP Spatial Pattern in the Yellow River Basin from 2000 to 2020.
3.2. Spatial Patterns and Changing Trends of TEI in the Yellow River Basin
Based on the calculation results of TEI in 2020, the distribution of integrity indices within the Yellow River Basin is as follows: less than 0.01% of the region had an integrity index below 0.2, 4.61% had an integrity index between 0.2 and 0.4, 20.96% had an integrity index between 0.4 and 0.6, 71.59% had an integrity index between 0.6 and 0.8, and 2.83% had an integrity index above 0.8 (Fig. 9).
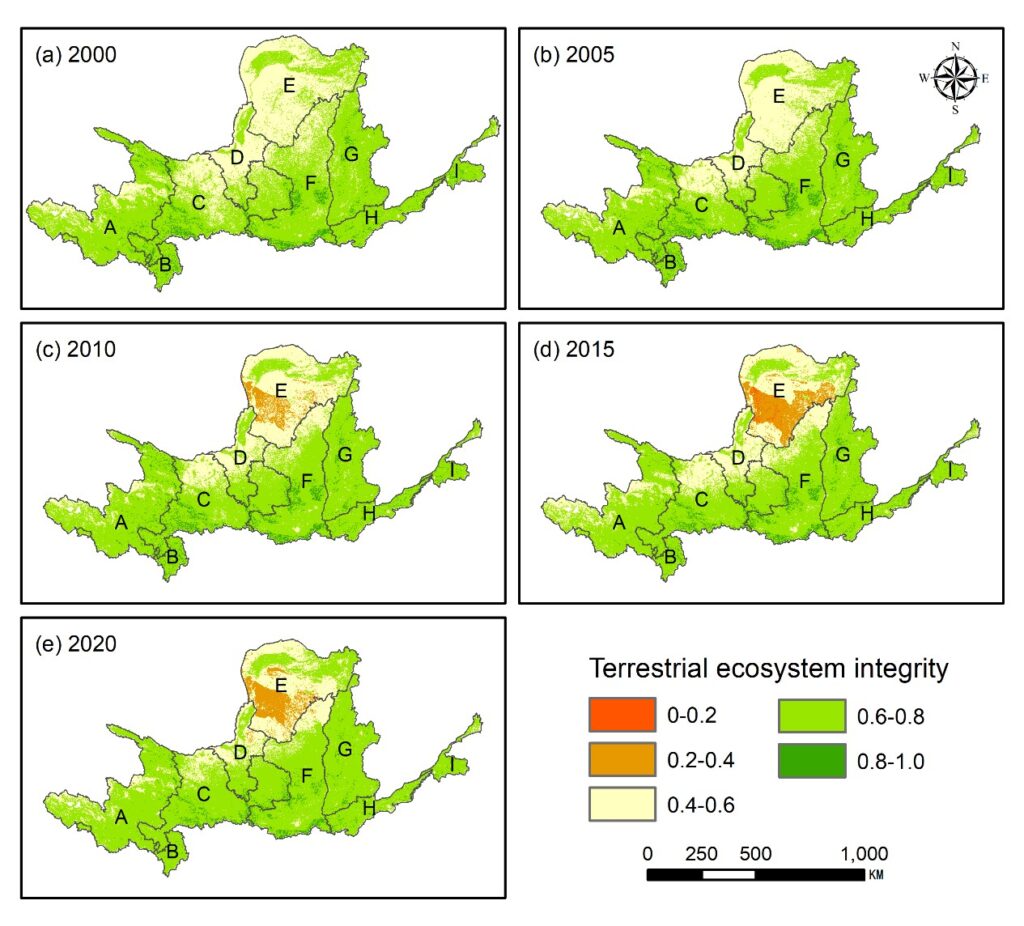
Figure 9. Spatial Patterns of TEI in the Yellow River Basin from 2000 to 2020. (0.8-1.0: Excellent; 0.6-0.8: Good; 0.4-0.6: Average; 0.2-0.4: Fair; 0-0.2: Poor). (A: Henan Province; B: Inner Mongolia Autonomous Region; C: Ningxia Hui Autonomous Region; D: Qinghai Province; E: Shandong Province; F: Shanxi Province; G: Shaanxi Province; H: Sichuan Province).
The spatial distribution of ecosystem integrity, as shown in Fig. 9, generally follows an elevation gradient, with higher integrity values in the southern parts and lower values in the northern regions. The upper reaches of the watershed, particularly in the Inner Mongolia section, exhibit the lowest TEI, while the middle and lower reaches show far superior integrity. In the southernmost parts of Gansu Province and central-southern Shaanxi Province, near the southern boundary of the drainage basin, areas with high integrity (0.8–1.0) are densely populated. In contrast, the central part of the Inner Mongolia Autonomous Region, near the northern boundary, has some of the lowest integrity values (0.2–0.4) within the watershed. Integrity values ranging between 0.4 and 0.6 are concentrated in areas near the river’s source and mouth, which are generally lower than the overall integrity in the basin.
Between 2000 and 2020, the TEI of the Yellow River Basin exhibited a trend of polarization, with an expansion of areas with integrity levels of 0.8 and below 0.4, while areas with integrity between 0.4 and 0.6 saw a decrease. The northern parts of Gansu Province, central and northern Ningxia Hui Autonomous Region, and central Shaanxi Province experienced notable improvements, especially between 2015 and 2020. On the other hand, the southern parts of Inner Mongolia saw the most significant decline in TEI, with continuous deterioration from 2000 to 2015 and a slight improvement from 2015 to 2020. Meanwhile, northern Shaanxi Province also saw a slight decrease in ecosystem integrity.
4. Discussion
4.1. Analysis on influencing factors of TEI in Yellow River Basin
The fragmentation of landscapes within the Yellow River Basin has been greatly affected by socio-economic activities, particularly in the middle and lower reaches, which have experienced significant changes from 2000 to 2018. In contrast, the upper reaches, particularly in areas like Qinghai Province and Sichuan Province, have seen relatively minor changes in fragmentation. Landscape separation indices in the upstream areas of Qinghai, Sichuan, and the downstream of Shandong showed some changes between 2000 and 2020, with Sichuan Province experiencing the largest increase. However, due to the smaller size of Sichuan within the basin, its impact on overall fragmentation is minimal. In five of the nine provinces in the basin, the largest patch index decreased, indicating an increase in landscape fragmentation.
The Yellow River Basin holds significant natural resources and plays a crucial role in China’s food and industrial production, contributing substantially to the nation’s economy (Liu and Dong, 2023). However, the expansion of agriculture and industry has put pressure on the ecological environment. The basin’s rich energy resources, including coal and natural gas reserves, have driven the development of many resource-based cities like Yinchuan, Yulin, and Ordos, where the energy sector is a vital component of economic growth (Xi et al., 2023). Despite the economic benefits, these industries, particularly heavy-polluting ones, contribute to ecological damage. As such, per capita GDP serves as a useful indicator for assessing the environmental pressure caused by industrial activities (Lin, 2019).
4.2 Impact of ecological protection measures in the Yellow River Basin
Since 2003, ecological restoration projects, such as the grassland restoration initiatives in the Qinghai-Tibet Plateau and Hetao Plain, have shown positive results. Specific measures like returning grazing land to grassland, banning grazing, and introducing rotational grazing have significantly improved the ecological health of alpine grasslands. These measures have led to increased plant community diversity, higher aboveground biomass, and improved CO2 sequestration. As a result, both Qinghai Province and Ningxia Hui Autonomous Region saw improvements in vegetation coverage and TEI between 2000 and 2020.
The “Returning Farmland to Forest and Grassland” program, initiated in 1999 for the Loess Plateau, has been successful in reducing soil erosion, increasing vegetation coverage, and improving regional carbon and water cycles (Liu et al., 2018; Liang and Jiao, 2019). These efforts have had a substantial positive impact on the ecosystem’s integrity, reducing fragmentation and enhancing biodiversity (Song et al., 2012; Liu et al., 2014). In the middle reaches of the Yellow River Basin, vegetation coverage and TEI improved significantly, although a slight decline was observed between 2010 and 2015. This aligns with findings from similar studies, such as those conducted in Taiyuan City (Qing et al., 2022).
In the lower reaches of the basin, especially in the Yellow River Delta, ecological restoration efforts like returning ponds to rivers and farmland to wetlands have been implemented to restore wetland ecosystems. Since 2010, multiple ecological water transfers along the Diao River Road have contributed to improvements in TEI in this area (Lv, 2014). While Henan and Shandong Provinces maintain high TEI, some medium-level integrity areas near the estuarine delta still require further attention. Continuous protection and management of these wetland ecosystems are crucial.
In summary, targeted ecological protection measures—tailored to local conditions—have been effective in restoring ecosystems across the Yellow River Basin. These interventions, such as the restoration of grasslands, forests, and wetlands, have contributed to improvements in vegetation coverage, biodiversity, and overall TEI.
5. Conclusions
This study provides a comprehensive review of TEI evaluation methods, with a focus on the Yellow River Basin. The TEI index and spatial distribution were analyzed, revealing the following key findings:
1. Terrestrial ecosystem integrity in 2020: Over 50% of the Yellow River Basin showed excellent TEI (2020), with minimal human impact. The basin exhibited a “high in the south, low in the north” spatial distribution of TEI. Areas in the upper reaches, such as Gansu, Ningxia, and Inner Mongolia, had lower TEI, while regions in the southern parts of the basin, particularly in Qinba Mountain and parts of Shaanxi and Henan Provinces, had higher integrity.
2. Trends from 2000 to 2020: The overall mean TEI index showed a dip in 2015, primarily due to drought, but it followed a fluctuating upward trend from 2000 to 2020. Provinces like Qinghai, Gansu, Ningxia, Shaanxi, Shanxi, Henan, and Shandong experienced improvements, while regions such as Sichuan and Inner Mongolia saw declines. The TEI trend displayed increasing polarization, with expansions in areas of both high and low integrity, and a reduction in areas with medium integrity.
3. Key Influencing Factors: Natural factors, socio-economic development, and ecological protection measures were identified as the primary drivers of TEI in the basin. Restoration initiatives, particularly in the middle and upper reaches, and wetland protection in the lower reaches, have shown positive effects on TEI. However, human pressures, particularly from industrial activities in the lower reaches, remain a significant challenge to long-term ecological stability.
In conclusion, ongoing ecological restoration and management efforts are essential to ensure the sustained protection and improvement of the Yellow River Basin’s ecosystems. Strengthening biodiversity conservation and managing human activities will be critical to achieving a harmonious balance between nature and development in the basin.
Author Contributions
Xiaoyu Zhang: Conceptualization, Software, Validation, Formal analysis, Investigation, Writing—Original Draft, Writing—Review & Editing, Visualization. Lei Feng: Methodology, Software, Writing—Review & Editing. Hong Zeng: Software. Ruijin Li: Software, Validation, Visualization, Writing—Review & Editing. Menggenxikexierge Cairibujiafu: Writing—Review & Editing. Zeyuan Wang: Investigation. Lizhen Cui: Investigation. Yuzhen Xing: Investigation. Zongsong Wang: Investigation. Zelin Zhang: Investigation. Ronghai Hu: Conceptualization, Data curation, Writing—Review & Editing, Funding acquisition. Xiaoning Song: Funding acquisition. Kai Xue: Funding acquisition. Yanfen Wang: Resources, Supervision, Project administration, Funding acquisition.
Declaration of Competing Interests
The authors declare that there are no known competing financial interests or personal relationships that influenced the work reported in this paper.
Data Availability
Data are contained within the article.
Acknowledgements
This research was funded by the Joint Research on Ecological Conservation and High- Quality Development of the Yellow River Basin program (2022-YRUC-01-0102). Yellow River Major Program of the National Natural Science Foundation of China (NSFC) (Grant No. 42041005). Beijing Nova Program of Science and Technology (Grant No. Z191100001119132), the Youth Innovation Promotion Association CAS, and the Xiaomi Young Scholar Program.
References
Ahn, C.H., Joo, J.C., Kwon, J.H., Song, H.M., 2011. Evaluation on Functional Assessment for Fish Habitat of Underground type Eco-Artificial Fish Reef using the Index of Biological Integrity (IBI) and Qualitative Habitat Evaluation Index (QHEI). KSCE Journal of Civil and Environmental Engineering Research 31(6B), 565–575. doi: 10.12652/Ksce.2011.31.6B.565.
Andreasen, J.K., O’Neill, R.V., Noss, R., Slosser, N.C., 2001. Considerations for the development of a terrestrial index of ecological integrity. Ecol. Indic. 1(1), 21–35. doi: 10.1016/S1470-160X(01)00007-3.
Aras, G.Y., F.M., 2020. Is there a relationship between environmental social performance and GDP per capita? Evidence from the G-20 countries. Öneri Dergisi 15(54), 463–479. doi: 10.14783/maruoneri.771661.
Awan, A.M.A., M., 2022. Evaluating the impact of GDP per capita on environmental degradation for G-20 economies: does N-shaped environmental Kuznets curve exist? Environment, Development and Sustainability 24(9), 11103–11126. doi: 10.14783/maruoneri.771661. doi: 10.1007/s10668-021-01899-8.
Birch, E.L., 2014. Climate Change 2014: Impacts, Adaptation, and Vulnerability. J. Am. Plan. Assoc. 80(2), 184–185.
Bochio, G.M., Anjos, L., 2012. The importance of considering bird detectability for assessing biological integrity. Natureza & Conservação 10(1), 72–76. doi: 10.4322/natcon.2012.012.
Cai C, Ding S, Shi Z, et al. Study of Applying USLE and Geographical Information System IDRISI to Predict Soil Erosion in Small Watershed. Bulletin of Soil and Water Conservation [J]. 2000, 19-24.
Cao, Z., Ma, W., Zhang, C., Tan, P., 2023. Comprehensive evaluation and stability analysis of ecosystem quality of Yellow River Basin during 1980–2019. River 2(2), 239–248. doi: 10.1002/rvr2.46.
Chauvenet, A.L., 2023. The conservation potential of protected areas over time measured through design and ecological integrity indicators is affected by land conversion. Biological conservation 279, 109908. doi: 10.1016/j.biocon.2023.109908.
Chen, L., Li, Y., Tian, S., Liu, M., Jia, Y., Yang, Y., Yuan, X., Wang, Q., Ma, Q., Li, Y., 2023. Evaluating and optimizing the ecosystem health of China’s Yellow River Basin based on emergy analysis and multi-objective decision method. Environment, Development and Sustainability, 1–25. doi: 10.1007/s10668-023-04175-z.
Chen, W.C., G.; Li, J., 2020. The spatial aspect of ecosystem services balance and its determinants. Land Use Policy 90, 104263, 104263. doi: j.landusepol.2019.104263.
Chin, A.T., Tozer, D.C., Walton, N.G., Fraser, G.S., 2015. Comparing disturbance gradients and bird-based indices of biotic integrity for ranking the ecological integrity of Great Lakes coastal wetlands. Ecol. Indic. 57, 475–485. doi: 10.1016/j.ecolind.2015.05.010.
Deng, R., 2020. Assessment of Ecosystem Integrity in the Potential Construction Area of the Third Pole National Park Group. doi: 10.26986/d.cnki.gcdlc.2020.000936 (in Chinese).
Fang, L., Wang, L., Chen, W., Sun, J., Cao, Q., Wang, S., Wang, L., 2021. Identifying the impacts of natural and human factors on ecosystem service in the Yangtze and Yellow River Basins. J. Cleaner Prod. 314, 127995. doi: 10.1016/j.jclepro.2021.127995.
Fernandes, A., Fernandes, L.S., Moura, J., Cortes, R., Pacheco, F., 2019a. A structural equation model to predict macroinvertebrate-based ecological status in catchments influenced by anthropogenic pressures. Sci. Total Environ. 681, 242–257. doi: /10.1016/j.scitotenv.2019.05.117.
Fernandes, A.C.P., Sanches Fernandes, L.F., Terêncio, D.P.S., Cortes, R.M.V., Pacheco, F.A.L., 2019b. Seasonal and scale effects of anthropogenic pressures on water quality and ecological integrity: a study in the Sabor River Basin (NE Portugal) using partial least squares-path modeling. Water 11(9), 1941. doi: 10.3390/w11091941.
Fraser, R., Olthof, I., Pouliot, D., 2009. Monitoring land cover change and ecological integrity in Canada’s national parks. Sci. Total Environ. 113(7), 1397–1409. doi: 10.1016/j.rse.2008.06.019.
Grabas, G.P., Blukacz-Richards, E.A., Pernanen, S., 2012. Development of a submerged aquatic vegetation community index of biotic integrity for use in Lake Ontario coastal wetlands. J. Great Lakes Res. 38(2), 243–250. doi: 10.1016/j.jglr.2012.02.014.
Grantham, H., Duncan, A., Evans, T., Jones, K., Beyer, H., Schuster, R., Walston, J., Ray, J., Robinson, J., Callow, M., 2020. Anthropogenic modification of forests means only 40% of remaining forests have high ecosystem integrity. Nat. Commun. 11(1), 5978. doi: 10.1038/s41467-020-19493-3.
Guo, P., Zhang, F., Wang, H., 2022. The response of ecosystem service value to land use change in the middle and lower Yellow River: A case study of the Henan section. Ecol. Indic. 140, 109019. doi: 10.1016/j.ecolind.2022.109019.
Guo, S., Li, L., Wang, S., Huang, J., Xie, X., Wang, Y., 2024. What are the dominant drivers and optimal thresholds for a healthy ecosystem in the Yellow River Basin, China? from a perspective of nonlinear nexus. Ecol. Indic. 162, 111997. doi: 10.1016/j.ecolind.2024.111997.
Huang, B., Zheng, H., Wang, X., Miao, H., 2006. Connotation of ecological integrity and its assessment methods: A review. Chinese Journal of Applied Ecology 17(11), 2196–2202 (in Chinese).
Ji, W., Liu, H.-J., Gao, J., Ma, H., Song, T., Gao, Y.-N., Feng, C.-Y., 2021. Spatial-temporal variations of ecological quality in the Yellow River Basin. doi: 10.13198/j.issn.1001-6929.2021.03.17.
Jiang, M., Pang, X., Wang, J., Cao, C., 2018. Islands ecological integrity evaluation using multi sources data. Ocean & coastal management 158, 134-143. doi: 10.1016/j.ocecoaman.2018.03.033.
Karr, J.R., 1981. Assessment of biotic integrity using fish communities. Fisheries 6(6), 21–27. doi: 10.1577/1548-8446(1981)006<0021:AOBIUF>2.0.CO;2.
Leopoldo, A., 1949. A sand county almanac, and sketches here and there. Kotlicki, R.
Li, T., Huang, X., Jiang, X., Wang, X., 2018. Assessment of ecosystem health of the Yellow River with fish index of biotic integrity. Hydrobiologia. 814, 31–43. doi: 10.1007/s10750-015-2541-5.
Li S 2021. Research on the Temporal and Spatial Patterns and Influencing Factors of Industrial Pollution in the Yellow River Basin [M].
Liang, J., Cheng, W., Li, J., Dong, M., Zhou, T., Pan, S., 2022. Spatiotemporal patterns of landscape fragmentation and causes in theYellow River Basin. Acta Ecol. Sin 42(05), 1993–2009 (in Chinese).
Liang, Y., Jiao, y., 2019. Characteristics of sediment retention by check-dams before and after the “Grain for Green” project in the He-Long Reach of the Yellow River. Acta Ecol. Sin 39(12), 4579–4586 (in Chinese).
Lin, H., 2019. Study on ecosystem integrity evaluation method inFujian Delta Region. doi: 10.27022/d.cnki.gfzhu.2019.000218 (in Chinese).
Lin, H., Zhao, Y., 2022. Soil erosion assessment of alpine grassland in the source park of the yellow river on the qinghai-Tibetan plateau, China. Frontiers in Ecology and Evolution 9, 771439. doi: 10.3389/fevo.2021.771439.
Liu B, Tao H, Shi Z, et al. Spatial Distribution Characteristics of Soil Erodibility K Value in Qinhai-Tibet Plateau. Bulletin of Soil and Water Conservation [J]. 2014, 34: 11-16.
Liu, D., Chen, Y., Cai, W., Dong, W., Xiao, J., Chen, J., Zhang, H., Xia, J., Yuan, W., 2014. The contribution of China’s Grain to Green Program to carbon sequestration. Landscape ecology 29, 1675–1688. doi: 10.1007/s10980-014-0081-4.
Liu, J., Dong, H., 2023. Spatiotemporal differentiation characteristics and formation mechanism of high-quality economic development level in the Yellow River Basin. Statistics & Decision-Making 39(18), 114–118. doi: 10.3390/ijerph19042484 (in Chinese).
Liu, Y., 2021. Research on the boundary delineation method of nature reserve based on ecosystem integrity assessment. doi: 10.27157/d.cnki.ghzku.2021.004884 (in Chinese).
Liu, Z., Wang, B., Zhao, Y., Niu, X., 2018. Monitoring and evaluation of the effects of Grain for Green Project in theupper and middle reaches of China’s Yangtze River. Chinese Journal of Applied Ecology 29(08), 2463–2469. doi: 10.13287/j.1001-9332.201808.011 (in Chinese).
Lv, L., Li, X., Jiang, X., Dong, G., 2014. Perspective of Ecosystem Integrity in the Flow Path of Diaokou River Based on PSR Model. 2014 36(4), 79-81 (in Chinese).
Ma, X., Xu, X., Li, J., 2022. Changes of terrestrial ecosystem integrity index and driving factors in theYangtze River Delta from 2000 to 2018. Acta Ecol. Sin 42(09), 3738–3748 (in Chinese).
Manolaki, P., Chourabi, S., Vogiatzakis, I., 2021. A rapid qualitative methodology for ecological integrity assessment across a Mediterranean island’s landscapes. Ecological Complexity 46, 100921. doi: 10.1016/j.ecocom.2021.100921.
Mu S 2013. Impacts of climate change and LUCC on spatio-tempora dynamics of the crbon cycle in Inner Mongolia grassland [M].
Özkundakci, D., Hamilton, D.P., Kelly, D., Schallenberg, M., de Winton, M., Verburg, P., Trolle, D., 2014. Ecological integrity of deep lakes in New Zealand across anthropogenic pressure gradients. Ecol. Indic. 37, 45–57. doi: 10.1016/j.ecolind.2013.10.005.
Pan, B., 2021. Variations of Runoff and Sediment and their Responses to ClimateChange and Human Activities in the Yellow River. doi: 10.27280/d.cnki.gsdsu.2021.001785 (in Chinese).
Qing, M., Yang, C., Xu, L., Guo, Q., Ding, Y., Zhang, Y., 2022. Analysis of the spatiotemporal evolution of the coordinated developmentof ecosystem service value and economy in the Yellow River Basin. Journalof Earth Environment 13(04), 491-505 (in Chinese).
Schneider, E.D., Kay, J.J., 1994. Life as a manifestation of the second law of thermodynamics. Mathematical and computer modelling 19(6-8), 25–48. doi: 10.1016/0895-7177(94)90188-0.
Shen, W., Li, Y., Qin, Y., Cheng, J., 2023. Influencing mechanism of climate and human activities on ecosystem health in the middle reaches of the Yellow River of China. Ecol. Indic. 150, 110191. doi: 10.1016/j.ecolind.2023.110191.
Shi, Y., Wang, N., 2023. Spatio-temporal Dynamics and Spatial Variation of Ecological Integrity inTaiyuan based on Landscape Scale. Remote Sensing Technology and Application, 1–9 (in Chinese).
Smogor, R.A., Angermeier, P.L., 2020. Relations between fish metrics and measures of anthropogenic disturbance in three IBI regions in Virginia, In: Assessing the sustainability and biological integrity of water resources using fish communities. CRC press, pp. 585–610.
Song, F.Q., Kang, M.Y., Zheng, Z.L., Wang, L.C., Wang, G.Q., Feng, D.X., 2012. Variations of NPP and carbon stock benefits before and after the Grain for Green Project in Northern Shaanxi. Appl. Mech. Mater. 195, 1237–1242. doi: 10.4028/www.scientific.net/AMM.195-196.1237.
Song, Y., Wang, M., Sun, X., Fan, Z., 2021. Quantitative assessment of the habitat quality dynamics in Yellow River Basin, China. Environ. Monit. Assess. 193(9), 614. doi: 10.1007/s10661-021-09404-4.
Veselka, W., Anderson, J.T., Kordek, W.S., 2010. Using dual classifications in the development of avian wetland indices of biological integrity for wetlands in West Virginia, USA. Environ. Monit. Assess. 164, 533–548. doi: 10.1007/s10661-009-0911-z.
Wang P, Yu Q, Fei Y, et al. Scale Effect Analysis of Landscape Pattern in Wengniute Banner. Transactions of the chinese society for Agricultural Machinery [J]. 2020, 51: 223-231+181.Wischmeier, W.H.M., J., 1969. Relation of soil properties to its erodibility. Soil Sci. Soc. Am. J. 33(1), 131–137. doi: 10.2136/sssaj1969.03615995003300010035x.
Wu, J., 1991. Dissipative Structure, Hierarchical System Theory and Ecosystems. Chinese Journal of Applied Ecology(02), 181–186 (in Chinese).
Wu X 2024. Study on the impact of landscape fragmentation on carbon storage in typical karst fragile mountainous areas [M].
Xi, Z., Ma, L., Jin, F., Wang, N., Liu, Z., 2023. Spatiotemporal characteristics, types, and paths of industril transformation in typical resource-based cities in the Yellow River Basin. RESOURCES SCIENCE 45(10), 1977–1991. doi: 10.18402/resci.2023.10.05 (in Chinese).
Yang, J., Xie, B., Tao, W., Zhang, D., 2021. Ecosystem services assessment, trade-off, and bundles in the Yellow River Basin, China. Diversity. 13(7), 308. doi: 10.3390/d13070308.
Zhang, M., Wang, K., He, P., 2005. Advances in assessment of ecosystem integrity. Tropical Geography (01), 10–13+18 (in Chinese).
Zhang, W., Yi, S., Chen, J., Qin, Y., Chang, L., Sun, Y., Shangguan, D., 2021a. Characteristics and controlling factors of alpine grassland vegetation patch patterns on the central Qinghai-Tibetan plateau. Ecol. Indic. 125, 107570. doi: 10.1016/j.ecolind.2021.107570.
Zhang, X., He, S., Yang, Y., 2021b. Evaluation of wetland ecosystem services value of the yellow river delta. Environ. Monit. Assess. 193(6), 353. doi: 10.1007/s10661-021-09130-x.
Zhang, X., Yang, Y., Zhao, M., Han, R., Yang, S., Wang, X., Tang, X., Qu, W., 2022. Trade-off analyses of multiple ecosystem services and their drivers in the Shandong Yellow River Basin. Int. J. Environ. Res. Public Health. 19(23), 15681. doi: 10.3390/ijerph192315681.
Zhang, Y., Wang, Y., Sun, S., Chen, X., 2023. Quantifying interregional flows of ecosystem services to enhance water security in the Yellow River Basin, China. Journal of Water Resources Planning and Management 149(6), 04023018. doi: 10.1061/JWRMD5.WRENG-5891.
Zhou L, Lei B, Yang C. Research on Urban Thermal Landscape and Its Influencing Factors in Nan’an District of Chongqing City based on GWR Model. Environmental Impact Assessment [J]. 2023, 45: 107-114.
Zhu, Z., Mei, Z., Xu, X., Feng, Y., Ren, G., 2022. Landscape ecological risk assessment based on land use change in the Yellow River basin of Shaanxi, China. Int. J. Environ. Res. Public Health. 19(15), 9547. doi: 10.3390/ijerph19159547.
Zuo, Q., Hao, M., Zhang, Z., Jiang, L., 2020. Assessment of the happy river index as an integrated index of river health and human well-being: A case study of the Yellow River, China. Water 12(11), 3064. doi: 10.3390/w12113064.
Publisher’s Note
The statements, opinions and data contained in all publications are solely those
of the individual author(s) and contributor(s) and not of Recent Advances
S.L. and/or the editor(s). Recent Advances S.L. and/or the editor(s) disclaim
responsibility for any injury to people or property resulting from any ideas,
methods, instructions or products referred to in the content.