


Coupling spaceborne Solar-Induced Fluorescence and PRI to explain water stress variability in almond
Yue Wang
1,2,Victoria González-Dugo

1,3, 
Tomas Poblete
1,2, Dongryeol Ryu
2, Pablo J. Zarco-Tejada
1,2,3- School of Agriculture, Food and Ecosystem Sciences (SAFES), Faculty of Science (FoS), University of Melbourne, Melbourne, VIC 3010, Australia.
- Department of Infrastructure Engineering, Faculty of Engineering and Information Technology (FEIT), University of Melbourne, Melbourne, VIC 3010, Australia.
- Instituto de Agricultura Sostenible (IAS), Consejo Superior de Investigaciones Cientificas (CSIC), Avenida Menendez Pidal s/n, 14004 Cordoba, Spain.


Abstract
Remote sensing plays an essential role in assessing crop water stress by providing insights to understand the spatial variability of water requirements. Traditional methods, such as the Crop Water Stress Index (CWSI), rely on canopy temperature due to its connection with transpiration rates and stomatal conductance. However, these methods face challenges, particularly when applied across large areas. Recent advances in spaceborne hyperspectral imaging offer alternative opportunities by quantifying physiological indicators, including solar-induced fluorescence (SIF) and narrow-band indices related to the xanthophyll dynamics, such as the Photochemical Reflectance Index (PRI). This study investigates the effectiveness of spectral indices derived from the DLR Earth Sensing Imaging Spectrometer (DESIS) hyperspectral imagery onboard the International Space Station for monitoring water stress in a large heterogeneous almond orchard. By comparing these spectral indices against conventional high-resolution thermal-based CWSI, we evaluated their performance in explaining crop water stress variability across a large almond orchard. Our findings show that SIF and PRI were sensitive indicators of water stress variability captured by thermal data, being the two most significant predictors of crop water stress among the indices tested. The coupled SIF and PRI model achieved an overall accuracy of 82% and a kappa coefficient of 0.77 when compared against the high-resolution CWSI data, significantly outperforming other combinations of spectral indicators. The model estimate was consistent over the range of thermal CWSI-based stress distribution throughout the orchard. This study highlights the potential of spaceborne hyperspectral data for large-scale operational assessment of crop water stress as an alternative to the lower sub-optimal resolution thermal imaging technologies currently available.Keywords
Crop Water Stress Index (CWSI), Solar-induced Fluorescence (SIF), Photochemical Reflectance Index (PRI), DESIS, Almond1. Introduction
Water is essential for agricultural management as it plays a crucial role in promoting plant growth, fruit quality, and crop yield (Fischer, 1981, Hsiao et al., 1976). Efficient irrigation strategies are vital for maximizing water productivity, minimizing yield losses, optimizing irrigation practices, and ensuring sustainable resource management. To achieve these goals, growers require accurate, scalable, and cost-effective methods for monitoring crop water status. By detecting water stress early and responding promptly, they can prevent potential long-term physiological damage to plants and improve overall water productivity, leading to more resilient and productive agricultural practices (Burt et al., 1997, Chaves and Oliveira, 2004).
Remote sensing (RS) techniques, particularly through thermal-based canopy temperature measurements (Jackson et al., 1977), have shown great potential for rapid, repeated, and accurate assessment of crop water stress (Li et al., 2014). When plants experience water stress, they partially close their stomata, which reduces transpiration rates and evaporative cooling, leading to an increase in leaf temperature (Jones, 1999). This temperature response is the foundation of the Crop Water Stress Index (CWSI) (Jackson et al., 1981), which has been widely adopted as an effective tool for quantifying crop water stress at a fine spatial resolution (Zarco-Tejada et al., 2013, Park et al., 2017, Zarco-Tejada et al., 2012, Gonzalez-Dugo et al., 2013). Despite its advantages in providing valuable insights for assessing plant transpiration dynamics, CWSI-based assessments encounter several challenges originating from reliance on environmental conditions and the need for accurate baseline measurements, especially when applied over large areas. More specifically, the accuracy of CWSI is largely dependent on the slope of the non-water stressed baseline (NWSB), which varies among different species and environmental conditions. Additionally, accurate measurements of canopy temperature, air temperature, and vapor pressure deficit (VPD) are essential to ensure reliable assessment (Gonzalez-Dugo and Zarco-Tejada, 2024, Jackson et al., 1981). Furthermore, the relatively coarse spatial resolution of currently available satellite thermal sensors can only offer a limited representation of the actual crop water stress when CWSI is applied to agricultural fields with a mix of crops and bare soil, restricting its effectiveness for broad-scale precision irrigation management.
The use of multispectral and hyperspectral sensors provides detailed and valuable spectral insights into various aspects of plant physiology, including pigment composition, structural traits, and photosynthetic activity (see the review by Gerhards et al. (2019)). In comparison to thermal imagery, these images generally offer higher spatial resolution and are widely available from spaceborne platforms, making them a practical alternative for large-scale agricultural monitoring. Numerous studies have demonstrated that spectral vegetation indices obtained from multispectral or hyperspectral data can effectively evaluate plant health and water status (Roberto et al., 2016, Zhang and Zhou, 2019, Rodríguez-Pérez et al., 2007, Elvanidi et al., 2018). Among the various indicators, the Photochemical Reflectance Index (PRI) is widely recognized as a sensitive physiological spectral index that reflects the de-epoxidation state of the xanthophyll cycle activity and photosynthesis efficiency (Gamon et al., 1992). The PRI is calculated based on the normalized difference between reflectance values at 530 nm (sensitive to xanthophyll pigment absorption) and 570 nm (a reference band). Several studies have validated the sensitivity of PRI to water stress conditions (Thénot et al., 2002, Winkel et al., 2002, Panigada et al., 2014). For instance, Suárez et al. (2008) found that PRI is responsive to diurnal variations in physiological indicators of water stress, such as differences in canopy temperature and air temperature, stomatal conductance, and stem water potential. Additionally, Suárez et al. (2009) observed strong relationships between PRI and canopy temperatures in peach (r2=0.8), olive (r2=0.65), and maize (r2=0.72). These findings have led to PRI being widely utilized for water stress detection in agricultural monitoring at the airborne level (Stagakis et al., 2012, Rossini et al., 2013b, Rossini et al., 2013a, Zarco-Tejada et al., 2012, Suárez et al., 2010).
Over the past few decades, Solar-Induced Fluorescence (SIF) has gained great interest due to its close link with photosynthetic activity and sensitivity to both biotic and abiotic stresses, including water availability (see a full review on SIF by Mohammed et al. (2019)). SIF occurs when chlorophyll molecules absorb sunlight and re-emit a portion of the energy as fluorescence, which spans from 650 nm to 800 nm with two emission peaks at 685 nm and 740 nm. Several studies have demonstrated that SIF is capable of detecting plant responses to water stress (Ač et al., 2015, McFarlane et al., 1980, Panigada et al., 2014). Pérez-Priego et al. (2005) found that fluorescence in-filling in the oxygen-A (O2-A) band varied with water stress status in orchard trees, indicating that changes in water availability influenced fluorescence effects on canopy reflectance. Moreover, Zarco-Tejada et al. (2012) explored chlorophyll fluorescence derived from high-resolution UAV-borne hyperspectral imagery and confirmed its effectiveness along with crown temperature and PRI in detecting water stress at the canopy crown level in a citrus orchard. Xu et al. (2018) examined the diurnal responses of the airborne-derived canopy SIF and PRI under varying water stress conditions and found that both indicators effectively captured plant physiological changes. Although PRI and SIF have shown strong potential for detecting water stress responses at airborne and field levels, their performance and effectiveness for detecting water stress at the spaceborne scale have not been evaluated in depth, especially over heterogeneous and discontinuous fields such as almond orchards.
Given the limitations of current systems and the increasing availability of spaceborne hyperspectral sensors, there is a growing need to explore reliable, adaptable, and accessible indicators for monitoring water stress over large areas. The rapid evolution of spaceborne hyperspectral technology is evident, with many missions currently in development. Recent advancements in spaceborne imaging spectrometers have provided valuable moderate-resolution RS data, achieving a spatial resolution of 20-30 m at frequent temporal intervals across large spatial scales (Rast and Painter, 2019, Atzberger, 2013). Notable recent spaceborne hyperspectral sensors include the PRecursore IperSpettrale della Missione Applicativa (PRISMA) (Labate et al., 2009) and the Environmental Mapping and Analysis Program (EnMAP) (Guanter et al., 2015). Both sensors have a spatial resolution of 30 m with over two hundred spectral bands spanning from the visible near-infrared (VNIR) to shortwave infrared (SWIR) ranges. Additionally, upcoming hyperspectral missions are expected to enhance agricultural monitoring capabilities, including the Copernicus Hyperspectral Imaging Mission for the Environment (CHIME, with 20-30 m spatial resolution) satellite from the European Space Agency (ESA) (Rast et al., 2021), and the ESA’s Fluorescence Explorer FLEX (0.1-0.3 nm spectral resolution within 500-780 nm spectral range) (Drusch et al., 2016). Among these advancements, the new-generation German Aerospace Center (DLR) Earth Sensing Imaging Spectrometer (DESIS) (Eckardt et al., 2015) has been operational since August 2018 onboard the International Space Station (ISS). This sensor collects hyperspectral imagery over 235 narrow spectral bands in the VNIR at a 30-m spatial resolution (Krutz et al., 2019). Although DESIS was not specifically designed for capturing SIF, it collects spectra within the Fraunhofer lines at photosystem (PS) I (PS-I) and PS-II emission regions, making SIF calculations technically possible (Gupana et al., 2021). It offers fine spectral resolution along with moderate spatial resolution and global imaging capabilities.
In this study, we explored the potential of spaceborne hyperspectral imagery for operational monitoring of crop water stress in a large heterogeneous almond orchard. We evaluate the effectiveness of SIF and reflectance indices derived from DESIS for assessing water stress levels. Our approach compared the model built with these indices to high-resolution thermal-based CWSI data derived from an airborne thermal sensor with a spatial resolution of 60 cm. By examining the spatial consistency and large-scale applicability of the spectral indicators obtained from DESIS, we aim to determine the effectiveness of spaceborne hyperspectral data for irrigation management in large-scale monitoring efforts.
2. Materials and Methods
2. 1 Study site
The study was conducted in a commercial almond orchard covering 1,200 hectares, comprising 73 blocks located on the south bank of the Murray River in northwestern Victoria, Australia. This region is part of Australia’s largest almond-growing area and is characterized by a cold semi-arid climate (Köppen, 1884) with an average annual precipitation of 310 mm. The almond trees were planted in 2006 in concentrated blocks facing north-south, and in 2007 in scattered blocks arranged in both north-south and east-west orientations. They were planted in sandy loam soils, following a pattern of six rows per group: three rows of Nonpareil (alternating every two rows), two rows of Carmel, and one row of Price. A drip fertigation system was employed for efficient water and nutrient delivery, with an irrigation schedule designed to allow for a one-hour interval between the Nonpareil and the other varieties to optimize water supply and uptake. During the summer of 2020/2021, the orchard received a total irrigation volume of 12,795 m³/ha.
2. 2 Airborne thermal data acquisition for crop water stress detection
High-resolution thermal imagery for assessing crop water stress was acquired through an airborne RS campaign conducted on January 31, 2021. This flight was conducted during the pre-harvest stage under midday cloud-free conditions. A FLIR A655sc thermal infrared camera (FLIR Systems, Wilsonville, OR, USA), featuring a 45o angular field of view, was mounted on a pilot-operated aircraft from the HyperSens Remote Sensing Laboratory. The aircraft flew at an altitude of 550 m above ground level, achieving a ground sampling distance (GSD) of 60 cm per pixel. The acquired thermal imagery was processed and mosaicked using Pix4D photogrammetry software (Lausanne, Switzerland), producing a continuous temperature map of the study area. The thermal mosaic (Fig. 1a) displays spatial temperature variations, while Fig. 1b illustrates the average temperature distribution across the planting blocks. To separate the canopy from the soil and background effects, automatic segmentation was performed using Niblack’s thresholding method (Niblack, 1985). Additionally, a watershed segmentation approach based on Euclidean distance was applied to cluster tree crowns for further analysis.
Tree water stress levels were determined using the CWSI (Eq. 1) as defined by Idso et al. (1981). The CWSI calculation normalizes canopy temperature (Tc) against air temperature (Ta) and the VPD at the time of image acquisition. The CWSI boundaries were established based on two reference limits. The lower limit of the canopy/air temperature differential, denoted as (Tc – Ta)LL, represents the temperature difference of a fully transpiring canopy at its maximum cooling potential rate for a given VPD. Conversely, the upper limit, (Tc – Ta)UL, corresponds to non-transpiring conditions where the transpiration flux is zero. A specific NWSB (Eq. 2) established for almond trees by Bellvert et al. (2018) was adopted here. Ambient temperature and relative humidity data were obtained from a nearby weather station to support CWSI computations.


Figure 1. (a) Thermal mosaic of the study site captured on January 31, 2021, at 60-cm spatial resolution. (b) Mean temperature of each planting block across the study site, represented from cooler (dark purple) to hotter (light orange). The background map was sourced from OpenStreetMap.
2.3. Spaceborne DESIS hyperspectral imagery and SIF quantification
The hyperspectral imagery (Figs. 2a-2b) used in this study was obtained from the spaceborne DESIS instrument onboard the ISS. This instrument was collaboratively developed by Teledyne Brown Engineering and DLR as part of the Multi-User System for Earth Sensing (MUSES) platform and was successfully launched on June 29, 2018. For this analysis, a cloud-free DESIS image captured on January 23, 2021, was selected, which was one week prior to the airborne thermal campaign. DESIS features hyperspectral data in 235 spectral bands across the VNIR spectral region (400-1000 nm), with a full width at half maximum (FWHM) of 3.5 nm and a spectral sampling interval of 2.55 nm (Krutz et al., 2019). The ISS orbits the Earth at an altitude of 400 km, yielding a GSD of 30 m (Alonso et al., 2019). The study utilized the orthorectified Level-1C (L1C) top-of-atmosphere (TOA) radiance and Level-2A (L2A) surface reflectance products without spectral binning. Fig. 2c presents radiance spectra sampled from vegetation features within the DESIS scenes. To simulate the irradiance spectra during the acquisition of the DESIS image, data from three nearby weather stations at a similar distance to the study area were incorporated. Aerosol optical depth (AOD) data at processing level 1.5 was sourced from the nearest available Aeronet station located at Fowlers Gap (https://aeronet.gsfc.nasa.gov/new_web/index.html). Figs. 2d-2e present the irradiance data along with radiance spectra from vegetation and soil features, highlighting the alignment and depth of the O2-A absorption bands that are essential for deriving SIF.

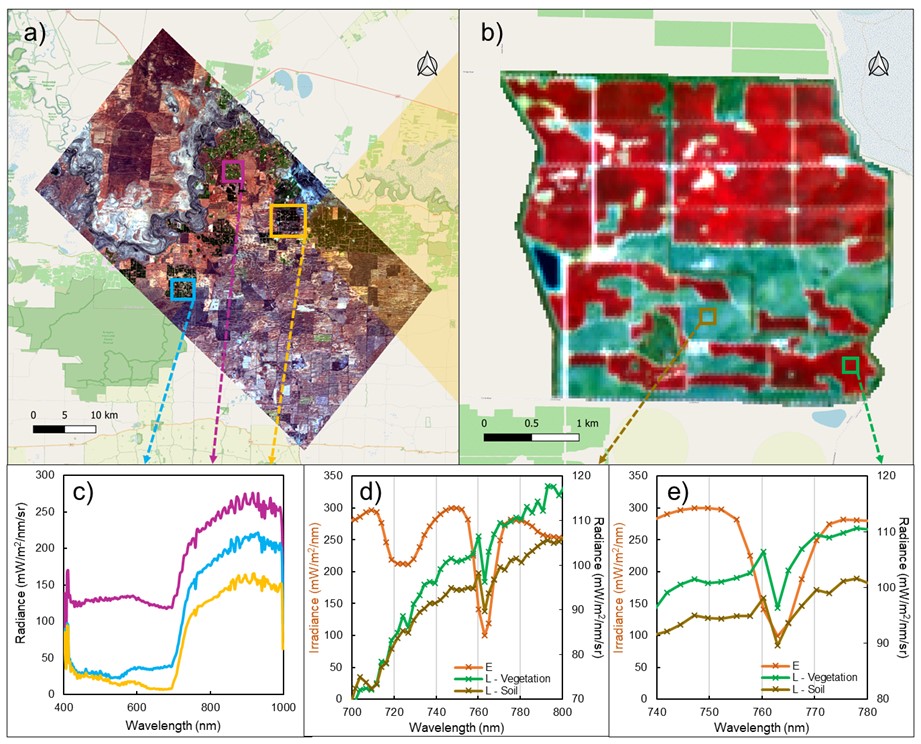
Figure 2. (a) Two adjacent scenes captured at 30-m pixel size by the spaceborne DESIS hyperspectral sensor. The yellow solid line marks the study site. (b) A colour-infrared (CIR-R: 860, G: 650, B: 550) overview of the 1200-ha study site, collected on January 23, 2021. (c) Radiance spectra from randomly selected fields from the DESIS scenes in a) within the visible and near-infrared spectral range (400-1000 nm). The irradiance (E) spectrum (shown in orange color) and the radiance (L) spectra for vegetation (shown in green color) and soil (shown in brown color) focused on d) the 700-800 nm spectral region, and e) highlight the O2-A feature around 760 nm. The background map was sourced from OpenStreetMap, featuring green patches to represent areas of vegetation.
The quantification of SIF was carried out using the Fraunhofer Line Depth (FLD) approach applied to the O2-A absorption band near 760 nm (Plascyk and Gabriel, 1975, Plascyk, 1975). The O2-A in-filling method was implemented by comparing the spectral windows within (‘in’) and outside (‘out’) of the absorption feature using irradiance (E) and TOA radiance (L) values, as outlined in Table 1. The minimum irradiance (Ein) and radiance (Lin) within the 755-765 nm range were identified at 762 nm. The maximum irradiance (Eout) and radiance (Lout) were determined at 744 nm and 775 nm, respectively, based on the spectral regions of 744–754 nm and 770–780 nm. To account for atmospheric and instrument calibration effects, a non-fluorescent soil-based correction approach was applied (Belwalkar et al., 2022). Due to the limited availability of AOD data from the nearby Aeronet station on the date of DESIS acquisition, SIF values were treated as relative proxies rather than absolute fluorescence measurements. In addition to SIF quantification, a range of spectral vegetation indices related to structural characteristics, chlorophyll a+b content, xanthophyll cycle activity, and water status were calculated from the DESIS-derived reflectance spectra, as detailed in Table 1.
Table 1. Equations for the spectral vegetation index from five index categories for crop water stress detection utilized in this study.


2.4. Algorithms for crop water stress assessment using spaceborne DESIS hyperspectral data
In this study, we assessed crop water stress in almond orchards using various spectral vegetation indices derived from DESIS hyperspectral imagery, as listed in Table 1. To address potential redundancy and multicollinearity among these indices, we performed a variance inflation factor (VIF) analysis (O’brien, 2007). A threshold of VIF < 10 was applied to retain independent non-collinear predictors, ensuring that selected spectral indices made distinct and meaningful contributions to the model. After dimensionality reduction, we implemented a Random Forest (RF) machine learning model (Breiman, 2001) to classify and predict water stress levels. The RF model underwent hyperparameter tuning, optimizing the number of trees, the maximum depth of each tree, and the number of features selected at each split. We assessed the relative contribution of each spectral index by examining the out-of-bag variable importance scores. To construct prediction models, a single representative predictor was selected from each index category based on its importance ranking or availability after VIF filtering. Ultimately, we tested a total of 12 model scenarios, which included both single-input models and two-input models.
To validate the predictive models, a high-resolution CWSI map derived from airborne thermal imagery was used as a reference. This thermal-based CWSI map focused exclusively on almond tree crowns, with segmentation performed to eliminate background elements such as soil and shadows. To ensure spatial compatibility with the coarser-resolution DESIS data (30-m GSD), we resampled the segmented thermal map using the Pixel Aggregate method in ENVI (Boulder, Colorado). The resampled airborne thermal pixels were then spatially aligned with DESIS pixels using the Snap Raster feature in ESRI ArcGIS Desktop (Redlands, CA, USA), ensuring precise one-to-one correspondence between datasets. The CWSI values were categorized into four water stress levels based on a histogram-based thresholding approach: 0-0.255 (no stress), 0.255-0.41 (mild stress), 0.41-0.6 (moderate stress), and 0.6-1.0 (severe stress). To ensure a balanced distribution across the four water stress levels, we employed a stratified random sampling approach (May et al., 2010). Specifically, 70% of the randomly selected pixels from each class were allocated for model training, while the remaining 30% were reserved for independent model testing. The accuracy of the water stress predictions was assessed by comparing the model outputs to the resampled thermal CWSI map using overall accuracy (OA) and kappa coefficient (κ) as performance measures. Finally, we applied the best-performing model to the entire orchard, generating a spatial CWSI distribution map that illustrated the four crop water stress levels across the study site.
3. Results and Discussions
3.1 Contributions of spectral predictors to explain crop water stress
After conducting an analysis of collinearity for all potential inputs from the available spectral vegetation index pool, several indices were retained: the xanthophyll index (PRI, PRI515), chlorophyll index (TCARI/OSAVI, CIred-edge), water index (WI), structural index (NDVI), and chlorophyll fluorescence (SIF), considering predictors with VIF of less than 10. The relative importance of these selected spectral indices for estimating CWSI is illustrated in Fig. 3.
Among all the candidates via the OOB method, SIF exhibited the highest importance, followed by the xanthophyll indices, chlorophyll indices, water index and structural index. This highlights the strong association of SIF with plant physiological status, particularly in terms of photosynthetic efficiency and stomatal regulation, which are highly sensitive to water stress, as supported by the studies of Zarco-Tejada et al. (2012) and Lee et al. (2013). The PRI and PRI515, which belong to the xanthophyll index, also demonstrated substantial importance. This suggests that changes in the xanthophyll cycle and photoprotective mechanisms are critical indicators of stress responses, further validating the role of photoprotective pigments in detecting water stress (Peguero-Pina et al., 2008, Suárez et al., 2008, Thénot et al., 2002). Following these, the chlorophyll index, such as TCARI/OSAVI, contributed moderately to the assessment. This indicates their relevance in identifying chlorophyll degradation under prolonged water stress conditions. However, changes in pigment composition appear to occur before any structural damage is evident, as the structural index NDVI demonstrated the least contribution. Interestingly, the water index WI showed mild importance, suggesting that the index derived from DESIS data may be relatively unresponsive. It presents a uniform representation of existing water stress variability, as evidenced by its narrow range of values, which spans from 1 to 1.1 that observed in the DESIS data. One hypothesis is to exercise caution when using this water index for detecting water stress, particularly when data is limited to the NIR range, which may contain noise and lack sensitivity to convey accurate information. Furthermore, the lower ranking of WI compared to SIF implies that physiological responses to stress, such as stomatal closure and fluorescence quenching, may be detected more immediately and effectively. These findings highlight the superiority of chlorophyll fluorescence and xanthophyll-based indices over traditional structural NDVI and chlorophyll-based indices in detecting water stress. The results suggest that integrating physiological indicators, such as SIF and PRI, into operational monitoring frameworks may enhance water stress detection in large-scale agricultural applications. A notable aspect of this study is that we derived the relative SIF value using TOA radiance and simulated irradiance through the FLD method, rather than absolute fluorescence measurements. While this method reduces the direct need for atmospheric correction, it may still influence the absolute accuracy of SIF retrievals. We acknowledge that refining atmospheric correction remains a priority to enhance the broader applicability and reliability of SIF-based assessments. Therefore, we suggest that future studies consider atmospheric correction, particularly when applying this approach across different environments, phenological stages, and multi-temporal implementations.


Figure 3. Importance of predictors (VIF<10) for estimating the Crop Water Stress Index (CWSI), categorized by Chlorophyll Fluorescence, Xanthophyll Index, Chlorophyll Index, Water Index, and Structural Index.
3.2. Model performance in estimating CWSI
Twelve combinations of one or two spectral predictors drawn from different categories were evaluated against the thermal reference. Table 2 presents the performance metrics of the model derived from DESIS, which were employed for predicting CWSI. Among the single-index models, the overall accuracy score ranged from 30% to 38%, with kappa coefficients ranging between 0.24 and 0.32. The relatively low accuracy across all single-index models suggests that no single spectral index is sufficient to fully capture the complexities of water stress dynamics. When two spectral indices were utilized in combination, the model performance exhibited notable variation. The pairing of PRI and SIF stood out, achieving a remarkably high accuracy of 82% and a kappa coefficient of 0.77. This finding emphasizes that the combination of SIF and PRI offers synergistic skills, delivering reliable predictive capabilities for assessing water stress. This effectiveness is likely attributed to their sensitivity to photosynthetic activity and the physiological changes linked to water stress. Other combinations of spectral indices also demonstrated varying levels of performance. For instance, the combinations of WI and SIF (OA=55%, κ=0.45), as well as TCARI/OSAVI and SIF (OA=41%, κ=0.36), resulted in moderate improvements over the single-index models. However, models that included the traditional index, such as NDVI, showed lower accuracy (37-39%) and kappa coefficient (0.32). This outcome suggests that NDVI may contribute supplementary information, but it does not serve as a primary predictor for effectively estimating water stress.
Table 2. Overall accuracy and Kappa statistics for models estimating the Crop Water Stress Index (CWSI) across the study site. Each model is defined by different predictor combinations drawn from different spectral index categories.


3.3. Comparison of thermal and DESIS-derived CWSI distribution
We compared the histogram and pixel distribution of the predicted CWSI obtained from the coarser-resolution DESIS imagery (30 m) with the high-resolution, resampled tree-crown CWSI derived from thermal imagery (originally has a spatial resolution of 60 cm). This analysis focused on four levels of water stress within the orchard, as shown in Fig. 4. Overall, both histograms exhibited comparable normal distributions. The histogram derived from thermal imagery (Fig. 4a) reveals a broad distribution with distinct peaks, reflecting the variability of water stress conditions in pure tree crowns. In contrast, the CWSI estimated from DESIS hyperspectral data (Fig. 4b) appears smoother and more centralized around the mean values, likely due to the aggregation of stress variability within each pixel. The pixel counts presented in Figs. 4c-4d further support the distribution across four stress levels, with the majority of pixels categorized as experiencing mild and moderate stress. This trend is particularly evident in the CWSI predicted by DESIS. While the relative proportions among classes remain comparable, slight discrepancies were observed, especially in the severe stress category. The DESIS-derived model tends to slightly underestimate the severe stress conditions compared to the thermal reference, especially when using the same threshold to define each stress level.
Figure 4. Histograms and pixel counts of Crop Water Stress Index (CWSI) derived from DESIS data. (a) Histogram of CWSI calculated from original thermal imagery at 60-cm spatial resolution based on pure tree crowns. (b) Histogram of estimated CWSI derived using the function f(PRI, SIF) from DESIS data at 30-m spatial resolution. (c) and (d) Corresponding pixel counts categorized into four relative stress classes: no stress, mild stress, moderate stress, and severe stress, respectively.


Figure 4. Histograms and pixel counts of Crop Water Stress Index (CWSI) derived from DESIS data. (a) Histogram of CWSI calculated from original thermal imagery at 60-cm spatial resolution based on pure tree crowns. (b) Histogram of estimated CWSI derived using the function f(PRI, SIF) from DESIS data at 30-m spatial resolution. (c) and (d) Corresponding pixel counts categorized into four relative stress classes: no stress, mild stress, moderate stress, and severe stress, respectively.
3.4. Spatial distribution of crop water stress levels across the almond orchard
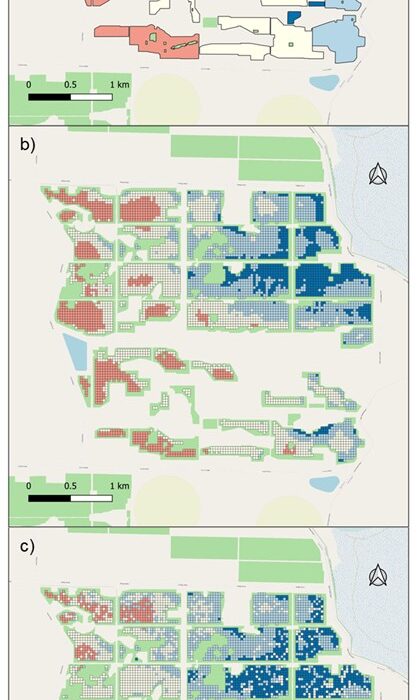
Fig. 5 shows the CWSI distribution throughout the entire orchard, comparing the thermal-derived reference map with predictions from hyperspectral-based indices. Overall, the spatial variability of the thermal-based CWSI that aggregated from tree crowns (Fig. 5a) closely corresponds with the thermal-based temperature data at the block level (Fig. 1b). These findings indicate that the northeastern blocks experienced better water availability or more efficient transpiration compared to the western blocks. However, some southeastern blocks displayed a more varied mix of moderate water stress than what is reflected in the temperature map.
The CWSI distribution based on DESIS pixel size reveals more detailed spatial patterns of water stress levels across blocks. The segmentation of tree crowns from thermal imagery (Fig. 5b) closely aligns with predictions derived from the PRI and SIF model extracted from DESIS (Fig. 5c). This demonstrates the effectiveness of combining PRI and SIF to capture major stress gradients. Nevertheless, the PRI and SIF model tends to slightly underestimate the severe stress compared to the thermal-derived reference. This discrepancy may be attributed to the mixed-feature effects at a coarser resolution. In particular, the areas of severe stress are concentrated in the western blocks, where the tree crowns are generally smaller and less dense. These mixed features, especially when aggregated into coarser pixels, likely cause the PRI and SIF model to reflect less pronounced stress. Mixed vegetation-soil pixels exhibit lower PRI and SIF values due to the effect of the percentage cover and the direct bare soil on the aggregated reflectance. Thus, the mixed pixels comprising all scene components include vegetation and non-vegetated areas, leading to an underestimation of water stress. Despite this challenge, these results suggest that combining PRI and SIF is effective in approximating CWSI. They highlight the potential of hyperspectral physiological indices for operational water stress monitoring, particularly when better resolution thermal data is unavailable at spaceborne scale for large-scale water stress mapping.
For practical applications, it is important to recognize that the inability to reliably detect extreme stress levels could compromise the accuracy of irrigation decisions in operational settings. Precise differentiation of stress levels is crucial, as delays in irrigation interventions may negatively affect crop yields. To address this issue, we suggest that future work integrate field assessments to determine stress levels based on specific thresholds. By incorporating this input, we can refine the model and improve the accuracy of stress detection under extreme conditions.
Furthermore, it is worth mentioning that this current study was conducted specifically during the pre-harvest stage, a critical stage in which both leaves and fruits have reached full maturity, and water stress conditions are typically at their most pronounced throughout the growing season. This timing allowed us to capture the maximum physiological response to water limitation, making it an optimal stage for assessing the sensitivity of model performance. While in earlier phenological stages, plants generally experience lower levels of stress, and their physiological responses are less variable across the orchard. This reduced variability may pose challenges for accurately detecting and assessing stress conditions. Consequently, model performance during these stages may differ and potentially show reduced sensitivity. Additionally, as SIF and PRI are highly dynamic and responsive to short-term changes in photosynthetic activity and stress conditions, their behavior can vary not only across phenological stages but also between species, orchard management practices, and environmental conditions. This suggests that model performance may be site- and context-dependent. Future evaluation studies that assess multiple phenological stages, different tree species, and various site conditions could help establish the reliability and general applicability of using SIF and PRI as indicators for monitoring water stress.


Figure 5. CWSI map a) over the planting blocks and b) at DESIS pixel level based on the tree segmentation from the thermal image at a spatial resolution of 60 cm collected on January 31, 2021. c) The predicted CWSI map based on PRI and SIF derived from the DESIS image collected on Jan 23, 2021. The background map was sourced from OpenStreetMap, featuring green patches to represent areas of vegetation.
4. Conclusions
The results of this study demonstrated the effectiveness of hyperspectral-derived indicators obtained from spaceborne DESIS hyperspectral imagery onboard the International Space Station to explain the variability of water stress in a large almond orchard. In particular, the Photochemical Reflectance Index (PRI) and the Solar-Induced Fluorescence (SIF) were the most two sensitive indicators to capture the water stress detected by thermal imaging. The coupled SIF and PRI indicators used to build the water stress model effectively explained CWSI obtained by high-resolution thermal imaging from a piloted aircraft. However, relying solely on single spectral indices, especially the Normalized Difference Vegetation Index (NDVI) and Water Index (WI), did not accurately explain water stress. By integrating these dynamic stress indicators related to the photosynthetic efficiency (SIF) and photoprotection (PRI), the accuracy explaining CWSI variability significantly improved, outperforming traditional structural (NDVI) and chlorophyll-related indices (i.e., TCARI/OSAVI). Comparisons carried out against high-resolution thermal-derived CWSI maps confirmed that these hyperspectral predictors effectively captured critical stress gradients throughout the almond orchard. These findings suggest that models built with hyperspectral physiological traits such as SIF and PRI offer a promising alternative for operational water stress monitoring, especially considering the limited availability of high-resolution thermal imagery for operational purposes.
Author Contributions
Yue Wang: Methodology, Software, Validation, Formal analysis, Investigation,
Visualization, Data Curation, Conceptualization, Writing – Original Draft.
Victoria Gonzalez-Dugo: Methodology, Writing – Review & Editing. Tomas
Poblete: Methodology, Data Curation, Writing – Review & Editing. Dongryeol
Ryu: Writing – Review & Editing. Pablo J. Zarco-Tejada: Funding acquisition,
Project administration, Resources, Supervision, Conceptualization, Methodol-
ogy, Writing – Review & Editing
Declaration of competing interest
The authors declare that they have no known competing financial interests or personal relationships that could have appeared to influence the work reported in this paper.
Acknowledgements
The authors gratefully acknowledge the McPherson Family and the Invergowrie Foundation for financial support through the Mallee Regional Innovation Centre (MRIC) and Brian Slater from Aroona Farms, and the German Aerospace Center (DLR) for providing access to DESIS imagery. Our thanks also extend to Peter Moar (Swinburne University), Lola Suarez (HyperSens, University of Melbourne) and QuantaLab IAS-CSIC (Spain) for laboratory support.
Funding
Funding from the Australian Research Council (ARC) project DP220101495 and the Spanish Ministry of Science and Innovation project PID2022-138451OB-I00 is gratefully acknowledged.
References
Ač, a., Malenovský, z., Olejníčková, j., Gallé, a., Rascher, u. & Mohammed, g. 2015. Meta-analysis assessing potential of steady-state chlorophyll fluorescence for remote sensing detection of plant water, temperature and nitrogen stress. Remote sensing of environment, 168, 420-436.
Alonso, k., Bachmann, m., Burch, k., Carmona, e., Cerra, d., De los reyes, r., Dietrich, d., Heiden, u., Hölderlin, a. & Ickes, j. 2019. Data products, quality and validation of the dlr earth sensing imaging spectrometer (desis). Sensors, 19, 4471.
Amatya, s., karkee, m., alva, a. K., larbi, p. & adhikari, b. Hyperspectral imaging for detecting water stress in potatoes. 2012 dallas, texas, july 29-august 1, 2012, 2012. American society of agricultural and biological engineers, 1.
Atzberger, c. 2013. Advances in remote sensing of agriculture: context description, existing operational monitoring systems and major information needs. Remote sensing, 5, 949-981.
Barnes, e., clarke, t., richards, s., colaizzi, p., haberland, j., kostrzewski, m., waller, p., choi, c., riley, e. & thompson, t. Coincident detection of crop water stress, nitrogen status and canopy density using ground based multispectral data. Proceedings of the fifth international conference on precision agriculture, bloomington, mn, usa, 2000. 6.
Bellvert, j., adeline, k., baram, s., pierce, l., sanden, b. L. & smart, d. R. 2018. Monitoring crop evapotranspiration and crop coefficients over an almond and pistachio orchard throughout remote sensing. Remote sensing, 10, 2001.
Belwalkar, a., poblete, t., longmire, a., hornero, a., hernandez-clemente, r. & zarco-tejada, p. 2022. Evaluation of sif retrievals from narrow-band and sub-nanometer airborne hyperspectral imagers flown in tandem: modelling and validation in the context of plant phenotyping. Remote sensing of environment, 273, 112986.
Breiman, l. 2001. Random forests. Machine learning, 45, 5-32.
Burt, c. M., clemmens, a. J., strelkoff, t. S., solomon, k. H., bliesner, r. D., hardy, l. A., howell, t. A. & eisenhauer, d. E. 1997. Irrigation performance measures: efficiency and uniformity. Journal of irrigation and drainage engineering, 123, 423-442.
Chaves, m. M. & oliveira, m. M. 2004. Mechanisms underlying plant resilience to water deficits: prospects for water-saving agriculture. Journal of experimental botany, 55, 2365-2384.
Drusch, m., moreno, j., del bello, u., franco, r., goulas, y., huth, a., kraft, s., middleton, e. M., miglietta, f. & mohammed, g. 2016. The fluorescence explorer mission concept—esa’s earth explorer 8. Ieee transactions on geoscience and remote sensing, 55, 1273-1284.
Eckardt, a., horack, j., lehmann, f., krutz, d., drescher, j., whorton, m. & soutullo, m. Desis (dlr earth sensing imaging spectrometer for the iss-muses platform). 2015 ieee international geoscience and remote sensing symposium (igarss), 2015. Ieee, 1457-1459.
Elvanidi, a., katsoulas, n., ferentinos, k., bartzanas, t. & kittas, c. 2018. Hyperspectral machine vision as a tool for water stress severity assessment in soilless tomato crop. Biosystems engineering, 165, 25-35.
Fischer, r. 1981. Influence of water stress on crop yield in semiarid regions.
Gamon, j., penuelas, j. & field, c. 1992. A narrow-waveband spectral index that tracks diurnal changes in photosynthetic efficiency. Remote sensing of environment, 41, 35-44.
Garrity, s. R., eitel, j. U. & vierling, l. A. 2011. Disentangling the relationships between plant pigments and the photochemical reflectance index reveals a new approach for remote estimation of carotenoid content. Remote sensing of environment, 115, 628-635.
Gerhards, m., schlerf, m., mallick, k. & udelhoven, t. 2019. Challenges and future perspectives of multi-/hyperspectral thermal infrared remote sensing for crop water-stress detection: a review. Remote sensing, 11, 1240.
Gitelson, a. A., gritz, y. & merzlyak, m. N. 2003. Relationships between leaf chlorophyll content and spectral reflectance and algorithms for non-destructive chlorophyll assessment in higher plant leaves. Journal of plant physiology, 160, 271-282.
Gonzalez-dugo, v. & zarco-tejada, p. 2024. Assessing the impact of measurement errors in the calculation of cwsi for characterizing the water status of several crop species. Irrigation science, 42, 431-443.
Gonzalez-dugo, v., zarco-tejada, p., nicolás, e., nortes, p. A., alarcón, j., intrigliolo, d. S. & fereres, e. 2013. Using high resolution uav thermal imagery to assess the variability in the water status of five fruit tree species within a commercial orchard. Precision agriculture, 14, 660-678.
Guanter, l., kaufmann, h., segl, k., foerster, s., rogass, c., chabrillat, s., kuester, t., hollstein, a., rossner, g. & chlebek, c. 2015. The enmap spaceborne imaging spectroscopy mission for earth observation. Remote sensing, 7, 8830-8857.
Gupana, r. S., odermatt, d., cesana, i., giardino, c., nedbal, l. & damm, a. 2021. Remote sensing of sun-induced chlorophyll-a fluorescence in inland and coastal waters: current state and future prospects. Remote sensing of environment, 262, 112482.
Haboudane, d., miller, j. R., tremblay, n., zarco-tejada, p. J. & dextraze, l. 2002. Integrated narrow-band vegetation indices for prediction of crop chlorophyll content for application to precision agriculture. Remote sensing of environment, 81, 416-426.
Hernández-clemente, r., navarro-cerrillo, r. M., suárez, l., morales, f. & zarco-tejada, p. J. 2011. Assessing structural effects on pri for stress detection in conifer forests. Remote sensing of environment, 115, 2360-2375.
Hsiao, t., fereres, e., acevedo, e. & henderson, d. 1976. Water stress and dynamics of growth and yield of crop plants. Water and plant life: problems and modern approaches. Springer.
Idso, s., jackson, r., pinter jr, p., reginato, r. & hatfield, j. 1981. Normalizing the stress-degree-day parameter for environmental variability. Agricultural meteorology, 24, 45-55.
Jackson, r. D., idso, s., reginato, r. & pinter jr, p. 1981. Canopy temperature as a crop water stress indicator. Water resources research, 17, 1133-1138.
Jackson, r. D., reginato, r. & idso, s. 1977. Wheat canopy temperature: a practical tool for evaluating water requirements. Water resources research, 13, 651-656.
Jones, c. L., weckler, p. R., maness, n. O., stone, m. L. & jayasekara, r. Estimating water stress in plants using hyperspectral sensing. 2004 asae annual meeting, 2004. American society of agricultural and biological engineers, 1.
Jones, h. G. 1999. Use of infrared thermometry for estimation of stomatal conductance as a possible aid to irrigation scheduling. Agricultural and forest meteorology, 95, 139-149.
Kim, y., glenn, d. M., park, j., ngugi, h. K. & lehman, b. L. Hyperspectral image analysis for plant stress detection. 2010 pittsburgh, pennsylvania, june 20-june 23, 2010, 2010. American society of agricultural and biological engineers, 1.
Köppen, w. 1884. Die wärmezonen der erde, nach der dauer der heissen, gemässigten und kalten zeit und nach der wirkung der wärme auf die organische welt betrachtet. Meteorologische zeitschrift, 1, 5-226.
Krutz, d., müller, r., knodt, u., günther, b., walter, i., sebastian, i., säuberlich, t., reulke, r., carmona, e. & eckardt, a. 2019. The instrument design of the dlr earth sensing imaging spectrometer (desis). Sensors, 19, 1622.
Labate, d., ceccherini, m., cisbani, a., de cosmo, v., galeazzi, c., giunti, l., melozzi, m., pieraccini, s. & stagi, m. 2009. The prisma payload optomechanical design, a high performance instrument for a new hyperspectral mission. Acta astronautica, 65, 1429-1436.
Lee, j.-e., frankenberg, c., van der tol, c., berry, j. A., guanter, l., boyce, c. K., fisher, j. B., morrow, e., worden, j. R. & asefi, s. 2013. Forest productivity and water stress in amazonia: observations from gosat chlorophyll fluorescence. Proceedings of the royal society b: biological sciences, 280, 20130171.
Li, l., zhang, q. & huang, d. 2014. A review of imaging techniques for plant phenotyping. Sensors, 14, 20078-20111.
May, r. J., maier, h. R. & dandy, g. C. 2010. Data splitting for artificial neural networks using som-based stratified sampling. Neural networks, 23, 283-294.
Mcfarlane, j., watson, r. D., theisen, a. F., jackson, r. D., ehrler, w., pinter jr, p., idso, s. B. & reginato, r. 1980. Plant stress detection by remote measurement of fluorescence. Applied optics, 19, 3287-3289.
Mohammed, g. H., colombo, r., middleton, e. M., rascher, u., van der tol, c., nedbal, l., goulas, y., pérez-priego, o., damm, a. & meroni, m. 2019. Remote sensing of solar-induced chlorophyll fluorescence (sif) in vegetation: 50 years of progress. Remote sensing of environment, 231, 111177.
Niblack, w. 1985. An introduction to digital image processing, strandberg publishing company.
O’brien, r. M. 2007. A caution regarding rules of thumb for variance inflation factors. Quality & quantity, 41, 673-690.
Panigada, c., rossini, m., meroni, m., cilia, c., busetto, l., amaducci, s., boschetti, m., cogliati, s., picchi, v. & pinto, f. 2014. Fluorescence, pri and canopy temperature for water stress detection in cereal crops. International journal of applied earth observation and geoinformation, 30, 167-178.
Park, s., ryu, d., fuentes, s., chung, h., hernández-montes, e. & o’connell, m. 2017. Adaptive estimation of crop water stress in nectarine and peach orchards using high-resolution imagery from an unmanned aerial vehicle (uav). Remote sensing, 9, 828.
Peguero-pina, j. J., morales, f., flexas, j., gil-pelegrín, e. & moya, i. 2008. Photochemistry, remotely sensed physiological reflectance index and de-epoxidation state of the xanthophyll cycle in quercus coccifera under intense drought. Oecologia, 156, 1-11.
Pérez-priego, o., zarco-tejada, p. J., miller, j. R., sepulcre-cantó, g. & fereres, e. 2005. Detection of water stress in orchard trees with a high-resolution spectrometer through chlorophyll fluorescence in-filling of the o/sub 2/-a band. Ieee transactions on geoscience and remote sensing, 43, 2860-2869.
Plascyk, j. A. 1975. The mk ii fraunhofer line discriminator (fld-ii) for airborne and orbital remote sensing of solar-stimulated luminescence. Optical engineering, 14, 144339.
Plascyk, j. A. & gabriel, f. C. 1975. The fraunhofer line discriminator mkii-an airborne instrument for precise and standardized ecological luminescence measurement. Ieee transactions on instrumentation and measurement, 24, 306-313.
Rast, m., nieke, j., adams, j., isola, c. & gascon, f. Copernicus hyperspectral imaging mission for the environment (chime). 2021 ieee international geoscience and remote sensing symposium igarss, 2021. Ieee, 108-111.
Rast, m. & painter, t. H. 2019. Earth observation imaging spectroscopy for terrestrial systems: an overview of its history, techniques, and applications of its missions. Surveys in geophysics, 40, 303-331.
Roberto, c., lorenzo, b., michele, m., micol, r. & cinzia, p. 2016. 10 optical remote sensing of vegetation water content. Hyperspectral remote sensing of vegetation, 227.
Rodríguez-pérez, j. R., riaño, d., carlisle, e., ustin, s. & smart, d. R. 2007. Evaluation of hyperspectral reflectance indexes to detect grapevine water status in vineyards. American journal of enology and viticulture, 58, 302-317.
Rossini, m., fava, f., cogliati, s., meroni, m., marchesi, a., panigada, c., giardino, c., busetto, l., migliavacca, m. & amaducci, s. 2013a. Assessing canopy pri from airborne imagery to map water stress in maize. Isprs journal of photogrammetry and remote sensing, 86, 168-177.
Rossini, m., fava, f., cogliati, s., meroni, m., panigada, c., giardino, c., busetto, l., migliavacca, m., amaducci, s. & colombo, r. 2013b. Airborne hyperspectral imagery for early water stress detection in maize. Isprs journal of photogrammetry and remote sensing, 168-177.
Roujean, j.-l. & breon, f.-m. 1995. Estimating par absorbed by vegetation from bidirectional reflectance measurements. Remote sensing of environment, 51, 375-384.
Rouse, j. W., haas, r. H., schell, j. A. & deering, d. W. 1974. Monitoring vegetation systems in the great plains with erts. Nasa special publication, 351, 309.
Stagakis, s., gonzález-dugo, v., cid, p., guillén-climent, m. L. & zarco-tejada, p. J. 2012. Monitoring water stress and fruit quality in an orange orchard under regulated deficit irrigation using narrow-band structural and physiological remote sensing indices. Isprs journal of photogrammetry and remote sensing, 71, 47-61.
Suárez, l., zarco-tejada, p., berni, j., gonzález-dugo, v. & fereres, e. 2009. Modelling pri for water stress detection using radiative transfer models. Remote sensing of environment, 113, 730-744.
Suárez, l., zarco-tejada, p., gonzález-dugo, v., berni, j., sagardoy, r., morales, f. & fereres, e. 2010. Detecting water stress effects on fruit quality in orchards with time-series pri airborne imagery. Remote sensing of environment, 114, 286-298.
Suárez, l., zarco-tejada, p. J., sepulcre-cantó, g., pérez-priego, o., miller, j., jiménez-muñoz, j. & sobrino, j. 2008. Assessing canopy pri for water stress detection with diurnal airborne imagery. Remote sensing of environment, 112, 560-575.
Thénot, f., méthy, m. & winkel, t. 2002. The photochemical reflectance index (pri) as a water-stress index. International journal of remote sensing, 23, 5135-5139.
Vogelmann, J., Rock, B. & Moss, D. 1993. Red edge spectral measurements from sugar maple leaves. Titleremote sensing, 14, 1563-1575.
Winkel, T., Méthy, M. & Thénot, f. 2002. Radiation use efficiency, chlorophyll fluorescence, and reflectance indices associated with ontogenic changes in water-limited chenopodium quinoa leaves. Photosynthetica, 40, 227-232.
Xu, S., Liu, Z., Zhao, l., Zhao, H. & Ren, S. 2018. Diurnal response of sun-induced fluorescence and pri to water stress in maize using a near-surface remote sensing platform. Remote sensing, 10, 1510.
Zarco-Tejada, P. J., González-Dugo, V. & Berni, J. A. 2012. Fluorescence, temperature and narrow-band indices acquired from a uav platform for water stress detection using a micro-hyperspectral imager and a thermal camera. Remote sensing of environment, 117, 322-337.
Zarco-Tejada, P. J., González-Dugo, V., Williams, l., Suarez, l., Berni, J. A., Goldhamer, D. & Fereres, E. 2013. A pri-based water stress index combining structural and chlorophyll effects: assessment using diurnal narrow-band airborne imagery and the cwsi thermal index. Remote sensing of environment, 138, 38-50.
Zhang, f. & Zhou, g. 2019. Estimation of vegetation water content using hyperspectral vegetation indices: a comparison of crop water indicators in response to water stress treatments for summer maize. Bmc ecology, 19, 1-12.
Publisher’s Note
The statements, opinions and data contained in all publications are solely those
of the individual author(s) and contributor(s) and not of Recent Advances
S.L. and/or the editor(s). Recent Advances S.L. and/or the editor(s) disclaim
responsibility for any injury to people or property resulting from any ideas,
methods, instructions or products referred to in the content.