


Monitoring of Light Absorbing Impurities (LAIs) in Snow and Glaciers along the Central Andes
Raquel Sánchez-López
1,2*,Cristian Mattar

1,2, 
Claudio Bravo
3, Claudio Durán-Alarcón
4, Theo Manuel Jenk
5,6- Black Glacier SpA, Santiago, Chile.
- Laboratory of Analysis of the Biosphere (LAB), University of Chile, Chile.
- Centro de Estudios Científicos (CECs), Valdivia, Chile.
- CIIMAR – Interdisciplinar Centre of Marine and Environmental Research, Matosinhos, Portugal.
- PSI Center for Energy and Environmental Sciences, CH-5232 Villigen PSI, Switzerland.
- Oeschger Centre for Climate Change Research, University of Bern, Sidlerstrasse 5, CH-3012 Bern, Switzerland.
* Author to whom correspondence should be addressed.


Abstract
Chile is one of the countries with the largest glacier area in the world, accounting for approximately 80% of the glaciers in South America and vast zones of snow cover area. Climate Change in some regions of South America is generally characterized by increasing temperatures and decreasing precipitation, which have accelerated glacier retreat and reduced snowfall. Furthermore, in areas of the country conterminous to populated centers, glaciers and snow cover areas are particularly vulnerable due to exposure to pollution from urban centers and industrial activities related to nearby mining. Emissions from such anthropogenic sources result in increased deposition of impurities on their surfaces. These contaminants, known as LAIs (Light Absorbing Impurities) such as Black Carbon (BC), significantly reduce ice and snow albedo. In this study, a monitoring platform was developed to integrate satellite imagery for observing Black Carbon on snow and glacier surfaces. Sentinel 2 satellite data, corresponding to the Level-2 surface reflectance product, were utilized. Two glaciers were selected for analysis: one located in the central region near an active mining operation, named Olivares Gamma Glacier and another located away from urban centers, the Tupungatito Glacier. Satellite imagery data were compared with in-situ measurements. Snow pit samples were processed under standard laboratory conditions to quantify Black Carbon concentrations using single-soot particle photometry (SP2). Results indicated elevated Black Carbon concentration levels in the samples from Olivares Gamma, located in closer proximity to anthropogenic emission sources. These results enable the modeling of LAIs using radiative transfer models to establish sensitivity thresholds for glaciers to contamination by anthropogenic actions. Snow and albedo from in-situ stations present a systematic drift with satellite information, which can be attributed to the localization of the stations.Keywords
Andes Glacier, Snow, Black Carbon, Remote Sensing1. Introduction
Black Carbon (BC) is one of the major pollutants linked to anthropogenic emissions that can contribute to accelerated melting of glaciers and snow due to changing of the surface albedo. It is primarily produced by the incomplete combustion of fossil fuels and biomass and is considered the second-largest contributor to anthropogenic radiative forcing (Ramanathan and Carmichael, 2008). Evidence of BC influences on the cryosphere across the world is reflected in ice core records, showing a rapid increase of BC concentrations since the 1850s (Sigl et al, 2018; Gulev et al., 2021). While an increase in BC emissions continued in the beginning of the 20th century BC, a decrease is observed since the 1970s in some regions as a result of worldwide action plans. In Arctic and European ice cores, the reduction in BC concentration has been partially attributed to the Clean Air Act (Kang et al., 2020). Nevertheless, Antarctica, Asia, Oceania, South America and Africa experienced an ongoing increase on Black Carbon emissions, still affecting the cryosphere (e.g., Liu et al., 2023; Gulev et al., 2021; Xu et al. 2021; Cereceda-Balic et al., 2020).
The BC belongs to the Light Absorbing Impurities (LAIs) which also includes Brown Carbon (BrC), Carbon Black (CB), and Mineral Dust. However, BC and Mineral Dust are the most studied due to their significant impact on the surface of snow and glaciers (Hu et al., 2020). Global BC emissions from anthropogenic sources affected the snow and ice reducing albedo by darkening the surface and, in consequence, intensifying melt rates (Ren et al. 2024). In the current climate scenario, snow and glacier melting processes are of great relevance due to their connection with snow duration and water availability (Réveillet et al., 2022). This process can significantly affect water reservoirs, influencing seasonal river discharge and water availability during warmer periods.
To understand the impact of BC, several techniques have been developed to quantify the magnitude of these impurities. These techniques could be classified into a) laboratory measurements, b) atmospheric measurements and c) indirect measurements of BC concentrations. Laboratory measurements are often based on optical thermal analysis, which quantifies elemental carbon (proxy of BC) (Gillardoni et al. 2022; Zhang et al. 2020; Gul et al. 2021). Another method measures the mass of refractory Black Carbon (rBC) in aerosolized melted snow/ice samples using laser-induced incandescence analysis with a Single Particle Soot Photometer (SP2) (Konya et al. 2021; Wang et al. 2021). Concerning atmospheric BC mass, the most conventional technique is the Aethalometer, which employs an optical technique to determine BC concentrations (Panicket et al. 2021; Sandeep et al. 2022). Finally, indirect observations based on albedometers, field spectrometers or hyperspectral cameras measurements, allow to obtain on-site albedo measurements and therefore can be spatialized by using satellite imagery (Barandun et al. 2022). Chile is one of the countries in South America which presents the most abundance in glaciers and snow cover, which are affected by the climate forcing variables (Perez et al. 2018; Olivares-Contreras et al., 2019; Olivera-Guerra et al., 2022; among others). The Andes mountains gathered more than 30,000 glaciers and more than 4,000 km² of snow cover. In the central and southern zone of Chile, where BC research is still ongoing, a persistence of BC over the Andes has been detected (Rowe et al., 2019; Cordero et al., 2022). Several works have documented the transport of black carbon from anthropogenic centers throughout the central Andes cordillera revealing a high impact on glaciers and snow cover (Lapere et al., 2022 and references there-in) or new analytical methods for BC estimation over snow (Cereceda-Balic, 2019). This evidence can also be compared to remote sensing imagery, particularly, surface albedo, which also reveals the impact of BC and dust in its darkening trend (Barandun et al., 2022; Shaw et al., 2021). Despite these previous studies, there is still no consensus about the magnitude of BC concentration levels for many glaciers and snow covered areas. This knowledge is however critical to assess the impact of BC more quantitatively in terms of its radiative impact on the snow/glacier melting rate, which is of high social and economic relevance as it directly affects the water reservoirs for the summer season. The impact of BC can be modelled by using radiative transfer models such as the Snow Ice Aerosol Radiative version 3 (SNICAR v3) model (Hu et al. 2020; Flanner et al., 2021; Zhang et al., 2024), but information of BC concentrations from measurements are therefore required to surrogate information. To this end, the monitoring of BC is necessary to understand the anthropogenic contribution and its impact in water security at catchment scale. Thus, the main objective of this work aimed to estimate the BC concentration over the Central Andes of Chile and its relation to snowfall assessed by satellite and in-situ measurements. The structure of this work is detailed as follows; Section 2 describes the Study Area, Section 3, present data set, laboratory measurements and remote sensing data. Section 4 presents the results and analysis. Section 5 presents a brief discussion and section 6 shows the conclusion of this work.
2. Study Area
The Maipo River Basin, situated in the Central Andes of Chile, is one of the main water sources for Santiago, the main city of Chile. Glaciers and snow cover within this basin play a vital role in water availability, especially during summer seasons. The main land uses in this basin include urban, agriculture, prairies, scrub and forests, wetlands, bare soil, snow and glaciers, and water bodies. The basin has a Mediterranean climate, with a snow accumulation season from April to September and a melt season from October to March; this implies that streamflow is fed from precipitation mostly during winter and by snowmelt from the upper mountains during spring and summer (Genova and Wei, 2023). In this basin, glaciers are classified as debris covered, debris free and rock glaciers (Barcaza et al., 2017; Ayala et al., 2020). This work focuses on two free debris glaciers, the Olivares Gamma and the Tupungatito glaciers, affected by the Chilean Megadrought (Dussaillant et al., 2019; McCarthy 2022) and subject to different sources of atmospheric deposition (Lapere et al., 2022). The Olivares Gamma Glacier is located in the Olivares River sub-basin, exposed to mining activities due to its proximity to large-scale extraction operations and the pollutants generated by the city of Santiago. The Tupungatito Glacier is located near the Tupungatito Volcano and influenced by volcanic activity, which could deposit particles such as ash and carbon aerosols. These deposits can similarly alter snow reflectivity, mirroring the effects of anthropogenic emissions. Figure 1 presents the study area.


Figure 1. Context and location of the study area of this work. Upper left provides the regional context of the Maipo River Basin in South America (in yellow). Upper right shows the delineation of the basins where glaciers are located. Lower left shows the frontal zone of the Olivares Gamma Glacier, and lower right shows the frontal zone of the Tupungatito Glacier. Diamonds indicate the location of Chilean National Water Secretariat (DGA) monitoring stations. Source: Google Satellite Imagery
3. Data and Methods
3.1 Data Collection and Laboratory Measurements
A field expedition was carried out at the Olivares Gamma and Tupungatito glaciers during September of 2024. Snow samples were collected following a standardized field protocol to ensure data consistency and minimize contamination. Sampling sites were selected based on accessibility, spatial representativeness, and proximity to potential contamination sources. Prior to fieldwork, meteorological conditions were monitored for 10 days to assess precipitation, temperature, and wind speed. Sites were positioned upwind to minimize contamination from field personnel.
Snow pits were excavated and stratified into four depth layers: 0–5 cm, 5–25 cm, 25–50 cm, and 50–80 cm. Each layer was measured and characterized using the crystal card and English folding fiberglass ruler to measure the depth of each horizon. For each stratified snow horizon, two samples were extracted using a Snow density wedge sampler 1000 cc (Snowmetrics ®), obtaining the same volume which was carefully sampled to prevent cross-contamination and stored over Whirl-Pak bags. The snow temperature for each snow horizon was measured by using a Dial Extern Thermometer (snowmetrics ®).
Two snow pits were dug near the front of the Tupungatito Glacier, reaching a depth of 80 cm, while at the Olivares Gamma Glacier, due to lower snow accumulation, the snow pit reached up to 50 cm maximum depth. Samples were collected using sterilized tools, stored in Whirl-Pak bags, labeled according to a standardized coding system and transported using a portable freezer which maintains the temperature below -5ºC. This portable freezer uses an AC adaptor, and it has a battery capacity for 12 hours to prevent the melting process during transportation. Finally, styrofoam and dry ice were used to preserve the samples integrity until laboratory analysis. The collected snow samples were sent to the Paul Scherrer Institute (PSI) in Switzerland, where BC concentrations were analyzed using the Single Particle Soot Photometer (SP2). The SP2 technique allows for high-precision quantification of BC mass concentrations by detecting incandescence from soot particles exposed to a laser beam.
Snow samples collected during the field expedition were analyzed for refractory black carbon (rBC) concentrations, after melting at room temperature and 25 min sonication in an ultrasonic bath, using a Single Particle Soot Photometer (SP2, Droplet Measurement Technologies, USA) at PSI in Switzerland. The instrument was coupled to an APEX-Q equipped with a jet nebulizer (Elemental Scientific Inc., USA), with full details about the analytical set-up for liquid samples described in Wendl et al. (2014). More details about the later improved procedures applied in a study on Holocene black carbon based on and ice-core record of biomass burning in the Amazon Basin from Illimani, Bolivia (Osmont et al., 2019), and which were exactly followed here, can be found in Osmont et al. (2018).. All samples were split into three sub‐samples, allowing for triplicate measurements.
3.2. Remote Sensing Data
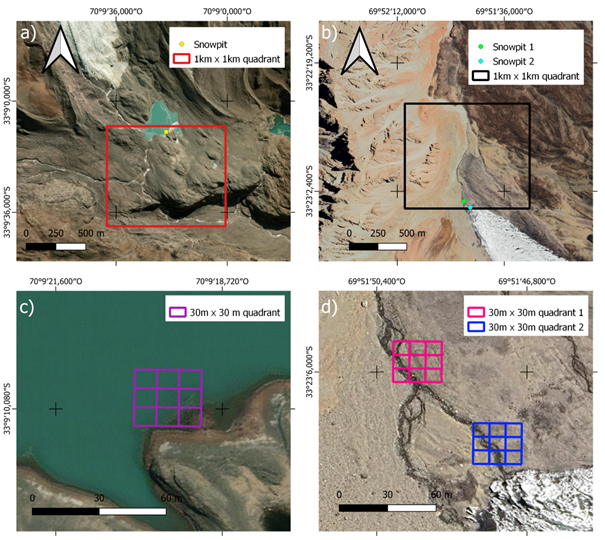
To evaluate the spatial variability of NDSI and albedo, values are extracted from the sampling points used and from a 1 km x 1 km quadrant, represented by a 1 km² area (Fig. 2).

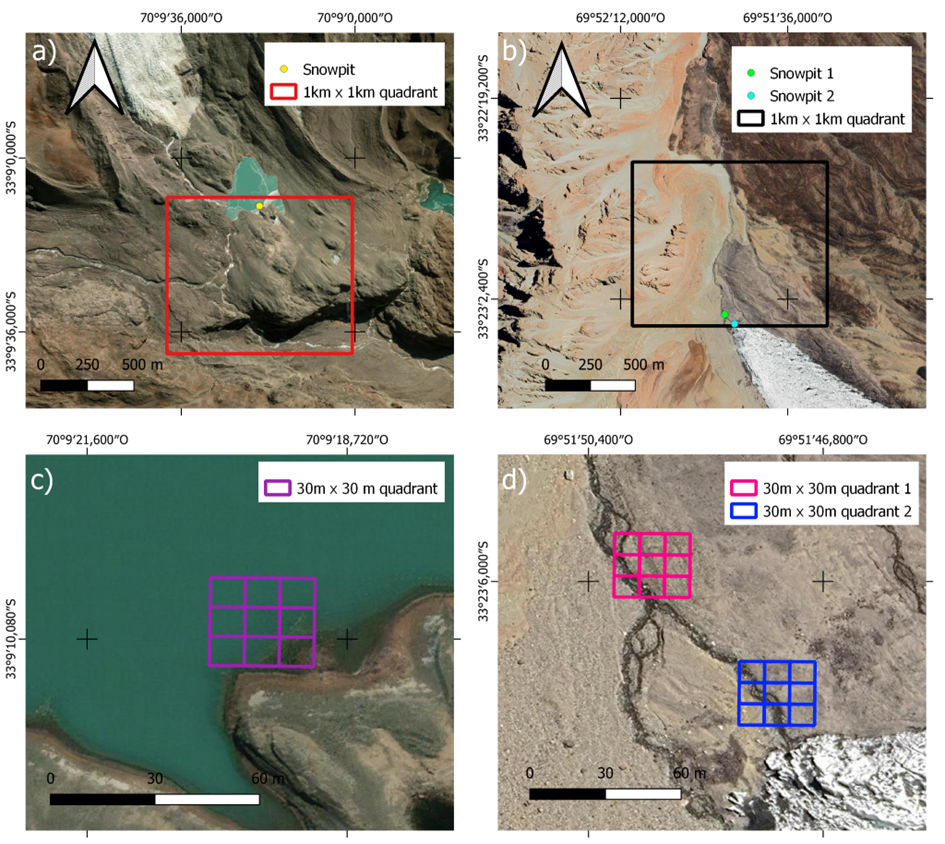
Figure 2. Quadrants used for spatial analysis, panels a) and b) show the 1 km × 1 km quadrants located at the front of Olivares Gamma and Tupungatito glaciers, respectively, panels c) and d) display the 3-pixel Sentinel-2 grids, centered on each snowpit pixel.Source: Google Satellite Imagery (b, d) and Bing Satellite (a, c)
To ensure the suitability of the images for snow and albedo analysis, the Sentinel-2 Level 2A dataset (COPERNICUS/S2_SR), pre-processed using the ESA’s Sen2Cor algorithm, were used. This provides imagery with atmospheric and radiometric correction. Image selection is confined to the period between October 1, 2023, and September 30, 2024.
Sentinel-2 imagery was filtered to retain only scenes with less than 20% cloud cover and full spatial coverage of the study area, defined as a 1 km² buffer at the glacier front. Cloud-contaminated and anomalous pixels were removed using the Scene Classification Layer (SCL), by masking pixels classified as clouds, cloud shadows, or saturated/defective. An additional reflectance-based filter excluded pixels with unrealistic values (e.g., reflectance > 1.0 in any band). The cloud removal filter is essential for Andes mountains terrain to extract the correct values of snow cover (Mattar et al., 2022).
To determine the snow cover, the Normalized Difference Snow Index (NDSI) proposed by Hall et al. (1995) was used. This multispectral index is useful to estimate snow phenology and the impact of snowfall which are directly related to snowpit characteristics. This multispectral index is calculated using the following equation:


where 


On the other hand, surface albedo is estimated following the method proposed by Liang (2001), which integrates various Sentinel-2 bands (Lin et al., 2022)


where b2, b4, b5, b6 and b7 are the spectral bands of Sentinel-2. This equation was selected because it has been shown to have higher accuracy than other Landsat albedo algorithms (Naegeli et al., 2017; Traversa et al., 2021).
Only images where both albedo and NDSI were successfully generated were retained for analysis. Time series of mean albedo and NDSI were extracted over three spatial scales: (i) the full 1 km² quadrant, (ii) the central snowpit point, and (iii) a 3×3 pixel window (~30 × 30 m) centered on the snowpit pixel.
In-situ measurements obtained from the Chilean National Water Secretariat (DGA) were also used. These stations are named Olivares Gamma Glacier and Tupungatito Glacier, respectively, which were selected according to the snowpit locations. These stations are well instrumentally equipped to measure short and long wave radiation, air temperature and relative humidity, snow depth, wind speed and direction and solid/liquid precipitation. The surface albedo, snow depth, liquid/solid precipitation data and air temperature and relative humidity were used to compare satellite imagery and to validate the snowfall occurrence, which may affect BC concentration. In the case of wind speed and direction, these measurements were used to evaluate the BC backtrajectory to determine the possible sources of anthropogenic (mining and city) or natural emissions (volcano).
3.3 Snow, Ice, and Aerosol Radiative Model (SNICAR) Modelling
The SNICAR Model was developed by Flanner et al. (2021) in order to estimate the impact of black carbon and snow/ice impurities on the spectral albedo. In order to assess the effect of BC in the spectral albedo for Tupungatito and Olivares snow pits, SNICAR ADv3 was used in this work. For the simulation, clear sky, summer, high mountain atmospheric conditions were assumed, and snow grain size was measured using a ruled plate (see Figure 3 and 4), with average isolated crystal size ranging from 500 to 1000 um for all depths. The depths of the snowpack layers in each snowpit for Tupungatito were 5, 20, 25 and 30 cm, and in the case of Olivares they were 5, 25 and 30 cm, from shallow to deeper layers. The density in both snow pits was assumed equivalent to 400 kg m-3 which was also used in previous work (Figueroa-Villanueva et al.2023; Cornwell et al., 2016). The solar zenith angle values were estimated from the time and geographic position for each snowpit during the field campaign.
4. Results
4.1. Snowpit Characterization
For Tupungatito Glacier, the snowpit is presented in Figure 3. Four main layers were identified from the 0-5 cm, 5 to 25, 25 to 50 and 50 to 80 cm depth. In most cases, the structure of snow is characterized by faceted snow grains. The temperature difference between the first and the last layer was about -5 °C in the first snowpit and -1°C in the second. The snow hardness varies from very low to high from the first to the last layer. It might be attributed to a recent snowfall which may affect the first layer. It is important to note that the two snowpits generated in Tupungatito Glacier present similar features for each layer.
On the other hand, for Olivares Glacier snow pit is presented in Figure 4. In this case, only three stratigraphic snow layers were identified at 0-5 cm, 5 to 25, 25 to 50 cm depth. The temperature difference between the first and the last layer was about 1.5°C. The snow hardness varies from very low to medium from the first to the last layer. This might be attributed to the fact that the snow pit is located on the frozen lake and the snow melt season is close to starting, so the hardness of the snow is lower than Tupungatito. In this snowpit, a marked brown layer was identified and attributable to the particle deposition during the snow season.


Figure 3. Snowpit at Tupungatito Glacier where four stratigraphic layers were identified for a) 0 – 5 cm, b) 5 – 25 cm, c) 25 – 50 cm and d) 50 – 80 cm.


Figure 4. Snowpit at Olivares Glacier where three stratigraphic layers were identified for (a) 0-5 cm, (b) 5 – 25 cm and (c) 25 – 50 cm.
4.2. Black Carbon Concentration
Table 1 presents the BC derived from laboratory measurements. Snow pits from Tupungatito Glacier (GT) exhibit higher variability in BC concentrations, particularly in the upper depth intervals (0-5 cm and 5-25 cm). For example, GT-N2-1 (0-5 cm) shows the highest BC concentration of 3.9 ppb. The deeper layers (25-50 cm and 50-80 cm) generally display lower variability and concentrations. BC concentrations in Olivares Gamma Glacier (GO) snow pits are consistently lower and less variable compared to GT. The highest concentration observed in GO is 2.3 ppb in GO-3 (25-50 cm).
Table 1. BC results from SP2 for snow samples obtained from Glacier Olivares (GO) and Glacier Tupungatito (GT), with the analytical 1σ uncertainty provided. N represents the number of SnowPit (1 or 2). and the index I and SO, indicate the substrate ice or soil, respectively.
| Depth | Sample label | rBC concentration (ppb) | rBC site average (ppb) |
| 0 – 5 cm | GO-N1-1-I | 0.4 ± 0.2 | 1.7 |
| 5 – 25 m | GO-N1-2-I | 2.2 ± 0.4 | |
| 25 – 50 cm | GO-N1-3-I | 2.3 ± 1.6 | |
| 0- 5 cm | GT-N1-1-SO | 1.9 ± 1.0 | 0.7 |
| 5 – 25 cm | GT-N1-2-SO | 0.23 ± 0.05 | |
| 25 – 50 cm | GT-N1-3-SO | 0.2 ± 0.1 | |
| 50 – 80 cm | GT-N1-4-SO | 0.5 ± 0.4 | |
| 0- 5 cm | GT-N2-1-SO | 3.9 ± 2.9 | 1.1 |
| 5 – 25 cm | GT-N2-2-SO | 0.15 ± 0.03 | |
| 25 – 50 cm | GT-N2-3-SO | 0.22 ± 0.06 | |
| 50 – 80 cm | GT-N2-4-SO | 0.15 ± 0.08 |
4.3. Snowfall Analysis and Albedo
The time series of surface albedo for Olivares Gama Glacier and Tupungatito Glacier are presented in Figure 5 and Figure 6. In the case of Olivares Gamma Glacier, the albedo reflects a decrease between October and December related to the melted season, with decreasing values from 0.8 to 0.2. During January to April, the albedo showed slight variations in terms of its magnitude based on the proportion of cloud free pixels. The first snowfall was during April, marked by an abrupt change from 0.2 to 0.5. Then, the snow season generates a prevalence of the albedo values higher than 0.6. The differences between the glacier front and the snowpit points are strongly related to the number of cloud free pixels used for the average and topography. Indeed, the topography is a critical factor for albedo retrievals, which generate sudden uncertainties in the impact of pollutants on remote sensing correction artifacts.
In the case of Tupungatito Glacier, the albedo shows the same seasonal behavior as Olivares Gamma Glacier. This means that local factors based on the elevation of both glaciers did not affect the seasonal snow decrease or snowfall start season. The albedo retrieved from Sentinel – 2 during July is about 0.7 ± 0.2, in contrast to in-situ data which presents for the same time period albedo values of about 0.9 ± 0.1. The first snowfall of the season for the Tupungatito was detected on April 13, 2024. The satellite imagery acquisition for the 17th April showed values about 0.76 ± 0.05 and a value of 0.7 ± 0.1 for the 30m x.30m and 1km x 1km quadrants, respectively. In contrast, the in-situ sensor presented albedo values between 0.69 and 0.95 for 13th and 15th April, respectively. Lately, the albedo values increased by several snowfalls between May and October. Indeed, during that period, the albedo values obtained from S1 range between 0.65 and 0.85, in contrast to the in-situ values which range between 0.14 and 0.9. The lowest values of in-situ data during July and August might be attributed to local effects (i.e. topography or location of the station) which shows an accelerated melted process in relation to satellite derived snow and the influences on the albedo. In fact, the snow and albedo for different pixel sizes obtained from S2 remains quite similar during snowfall season in relation to the amplitude derived from in-situ data.
The satellite-derived albedo values decreased to 0.42 with a variance of 0.15, then remained constant between 0.6 and 0.7. These drops were even more pronounced in the in-situ data, reaching values as low as 0.13. This difference appears again during the next snowfall event: starting May 27, the satellite data show more stable values between 0.65 and 0.85 until the end of the snow accumulation period. In contrast, the in-situ albedo values dropped to 0.14 on July 17, which is one of the dates when the greatest snow cover would be expected in the area.
The observed in-situ albedo data from Olivares Glacier high consistency in the measurements during the accumulation period. The first snowfall recorded with in-situ data occurred on April 13, with an albedo value of 0.67. Then on May 7, with a value of 0.70, albedo remained relatively stable, ranging between 0.58 and 0.90 until the end of the accumulation period. Satellite data recorded an initial increase on April 17, with an albedo value of 0.52 ± 0.14 in the 1 km × 1 km quadrant. However, this increase was not observed in the 3×3 pixel window, where the albedo value was 0.17 ± 0.03. This difference could be attributed to the freezing point reached by the lake. Subsequently, on May 12th, the highest albedo values were recorded and remained stable until the end of the accumulation period, ranging between 0.73–0.85 and 0.58–0.73 in the 3×3 pixel window and the 1 km × 1 km quadrant, respectively.
The pixel size reveals the effect of the spatial resolution on the albedo values, especially where the site is located close to a complex terrain such as the slope of a mountain which is the case of Tupungatito. In the case of Olivares Glacier, the pixel linked to the snowpit is located on flat areas which only present important differences as compared to a coarse pixel. For instance, the albedo for the area of 1 x 1 km ranges between 0.6 and 0.7 albedo values during snow season, in contrast to the albedo values estimated for 30 x 30 m and snow pit pixel which ranges between 0.75 and 0.85 at the same time period. These variations could influence the times series of albedo and its possible trends attributed to BC influences or other impurities as it was mentioned in Figueroa-Villanueva et al. (2023).
When comparing the albedo values derived from satellite data with the modeled albedo outputs from SNICAR, significant differences are observed. At both the Olivares Gamma Glacier and the Tupungatito Glacier, the satellite-derived albedo values exceed 0.95 (Table 2), while the modeled albedo values remain below 0.85 during the same period. In the modelization of albedo the only impurity that was measured in the laboratory was the concentration of BC, which shows relatively low values. It is possible that the concentration of dust, brown carbon, volcanic ash and to a lesser extent the concentration of organic elements such as chlorophyll, combined with BC, may play an important role in the discrepancies between models and satellite observations.
Table 2 presents the total albedo reductions attributed to the presence of black carbon (BC), showing decreases of 0.002 at the Olivares Glacier snowpit (GO-N1), and 0.001 and 0.002 at the Tupungatito Glacier snowpits (GT-N1 and GT-N2), respectively. These values, derived from the SNICAR model, align with previous observations of BC-related albedo reductions in pristine Alaskan glaciers during the snow season (Konya et al., 2021). Figure 7 illustrates the spectral albedo differences between clean snow (assumed rBC = 0 ppb) and BC-impacted snow (using laboratory-measured concentrations reported in Table 2) within the visible portion of the electromagnetic spectrum. The most significant BC-induced albedo reductions occur at wavelengths below 1 µm, according to Flanner et al. (2021).
Another factor is that the albedo used in this comparison is provided by Sentinel-2 products (Lin et al., 2022), which do not include adequate illumination and slope corrections. This issue affects the spatial analysis using remote sensing and it can be evidenced by changing the spatial resolution between a single pixel to the upscaled aggregated pixel (10 m x 10 m to 1000 m x 1000 m). This issue deserves an appropriate topography dataset based on the theoretical model of Picard et al. (2020) which suggests the theoretical basis for snow correction models at complex terrain. Unfortunately, accurate elevation data have to be derived from in-situ measurements or high spatial resolution techniques (Shaw et al., 2019). For this work, the use of a digital complex terrain is not available and only related to the spatial resolution of the current remote sensing products.


Figure 5. NDSI, Albedo, Air Temperature and Humidity near Olivares Gamma Glacier.

Figure 6. NDSI, Albedo, Air Temperature and Humidity near Tupungatito Glacier.
Table 2. Decrease in albedo due to BC concentration. The column “Clean” corresponds to snow the albedo outputs considering rBC = 0 ppb and “BC” corresponds to the concentrations obtained from the snowpit samplesanalyzed in the laboratory. Final values were rounded to the third decimal place.
| Site | Albedo (SNICAR) | ||
| Clean | BC | Difference (Clean – BC) | |
| GO-N1 | 0.959 | 0.958 | -0.002 |
| GT-N1 | 0.962 | 0.961 | -0.001 |
| GT-N2 | 0.960 | 0.958 | -0.002 |


Figure 7. Spectral albedo derived from SNCAR v3 for the snowpit at the Olivares Glacier (blue lines) and the 2 snowpits at the Tupungatito Glacier (red and green lines). Solid lines correspond to the outputs using the laboratory values of BC concentration, and the dashed lines correspond to clean snow (BC concentration = 0 ppb).
5. Discussion
Remote sensing techniques were used to monitor surface albedo time series to determine BC pollutants over snow and glaciers. However, several factors such as transport and deposition, as well as topography, are involved in the BC concentrations and its impact on surface albedo. The spatial resolution of satellite imagery reveals strong influence between point to lower pixel scales. Some recent studies demonstrate changes in surface albedo, suggesting an influence of BC, although topographic corrections were not included (Figueroa-Villanueva et al., 2023). Moreover, the use of Liang surface albedo retrieval needs to be evaluated in terms of the effects on relief impact on albedo retrievals. Indeed, the use of theoretical albedo approaches developed by Piccard et al (2020) or similar surface albedo parameterization (Lee et al., 2024) has demonstrated the impact of correcting the topographic effect on albedo time series trends. This issue must be considered in albedo and black carbon assessment to separate the systematic error of surface albedo retrievals from surface albedo decreasing by black carbon presence. Regarding the in-situ data, the stations of DGA present a strong bias between the satellite and field campaign measurements. For Olivares Glacier, the station was located over barren areas meanwhile in the areas close to the Olivares Glacier, more than 50 cm of snow depth was detected by in situ measurements with surface albedo higher than 80% as revealed by satellite imagery. This condition biases the snow melt season only with attribution to the location of the station instead of the snow process forced by atmospheric conditions. Similar evidence is also presented for Tupungatito Glacier where in-situ albedo derived from DGA stations are close to 20% during July and August meanwhile satellite derived values are higher than 60% and snow depth was found close to 80 cm during fieldwork. These results suggest the sites selected by DGA for the purpose of snow monitoring were not ideally or ,at least, not representative of the study area in terms of albedo measurements. The comparison between satellite-derived albedo and in.situ data requires further analysis, calibration and validation for new approaches based on snow radiative transfer modelling at high mountains.
5. Conclusions
This work contributes to a better understanding of the impact of Black Carbon on snow processes in the central Andes using also remote sensing and modelling. The main results showed Black Carbon concentration in both Olivares Glacier and Tupungatito Glacier ranging between 0,15 and 3,9 ppb, determined from laboratory analysis of snow pit samples. These concentrations could be attributed to pollutants transportation from anthropogenic emission areas to the central Andes of Chile. The use of remote sensing and in-situ measurements reveals some discrepancies which are attributed to a not fully representative site where the stations are installed. Indeed, the location of in-situ station measurements indicate no snow cover area whereas a snow covered area with a depth of 40 cm was observed during the field campaign. Moreover, satellite imagery-derived albedo from GEE deserves a topographic correction for analysis in the Central Andes based on significant differences between upscaling data and modelling results. Notably, SNICAR simulations show that BC alone cannot explain the observed albedo reductions, pointing to the potential role of other light-absorbing impurities such as mineral dust. Clearly, further work should be conducted to assess the influence of surface albedo and its opacity, thereby using a topographic correction model, radiative transfer modelling, and an improved parameterization in SNICAR by introducing a more detailed characterization of the snowpack composition to be derived from direct observations in future field studies.
Author Contributions
Raquel Sánchez: Conceptualization, formal analysis, investigation,
methodology, project administration, resources, supervision, writing review
and editing.
Cristian Mattar: Conceptualization, formal analysis, investigation,
methodology, project administration, resources, supervision, writing review
and editing.
Claudio Bravo: Conceptualization, formal analysis, investigation,
methodology, writing review and editing.
Claudio Durán-Alarcón: Conceptualization, formal analysis, investigation,
methodology, writing review and editing.
Theo Jenk: Formal analysis, methodology, writing review and editing.
Declaration of competing interest
The authors declare that they have no known competing financial interests or personal relationships that could have appeared to influence the work reported in this paper.
Acknowledgements
The authors gratefully acknowledge Dr. Theo Jenk from the Paul Scherrer Institute (PSI) for his invaluable support with the laboratory analyses, ESA for SEN2cor products and GEE for time series analysis. The authors also would like to thank the Chilean Water Secretariat (DGA) for the data used in this work.
Funding
This research was funded by the Chilean National Agency for Research and Development (ANID) through Start Up Science project SUC230219.
References
Ayala, Á., Farías-Barahona, D., Huss, M., Pellicciotti, F., McPhee, J., & Farinotti, D. (2020). Glacier runoff variations since 1955 in the Maipo River basin, in the semiarid Andes of central Chile. The Cryosphere, 14(6), 2005-2027. https://doi.org/10.5194/tc-14-2005-2020
Barcaza, G., Nussbaumer, S. U., Tapia, G., Valdés, J., García, J. L., Videla, Y., … & Arias, V. (2017). Glacier inventory and recent glacier variations in the Andes of Chile, South America. Annals of Glaciology, 58(75pt2), 166-180. https://doi.org/10.1017/aog.2017.28
Barandun, M., Bravo, C., Grobety, B., Jenk, T., Fang, L., Naegeli, K., Rivera, A., Cisternas, S., Munster & Schwikowski, M. (2022). Anthropogenic influence on surface changes at the Olivares glaciers; Central Chile. Science of the Total Environment, 833, 155068. https://doi.org/10.1016/j.scitotenv.2022.155068
Cereceda-Balic, F., Gorena, T., Soto, C., Vidal, V., Lapuerta, M., & Moosmüller, H. (2019). Optical determination of black carbon mass concentrations in snow samples: A new analytical method. Science of The Total Environment, 697, 133934. https://doi.org/10.1016/j.scitotenv.2019.133934
Cereceda-Balic, F., Vidal, V., Ruggeri, M. F., & González, H. E. (2020). Black carbon pollution in snow and its impact on albedo near the Chilean stations on the Antarctic peninsula: First results. Science of the total environment, 743, 140801. https://doi.org/10.1016/j.scitotenv.2020.140801
Cordero, R. R., Sepúlveda, E., Feron, S., Wang, C., Damiani, A., Fernandoy, F., Neshyba, S., Rowe. P. M., Asencio, V et al. (2022). Black carbon in the Southern Andean snowpack. Environmental Research Letters, 17(4), 044042. https://doi.org/10.1088/1748-9326/ac5df0
Cornwell, E., Molotch, N. P., & McPhee, J. (2016). Spatio-temporal variability of snow water equivalent in the extra-tropical Andes Cordillera from distributed energy balance modeling and remotely sensed snow cover. Hydrology and Earth System Sciences, 20(1), 411-430. doi.org/10.5194/hess-20-411-2016
Dussaillant, I., Berthier, E., Brun, F., Masiokas, M., Hugonnet, R., Favier, V., … & Ruiz, L. (2019). Two decades of glacier mass loss along the Andes. Nature Geoscience, 12(10), 802-808. https://doi.org/10.1038/s41561-019-0432-5
Figueroa-Villanueva, L., Castro, L., Bolaño-Ortiz, T. R., Flores, R. P., Pacheco-Ferrada, D., & Cereceda-Balic, F. (2023). Changes in Snow Surface Albedo and Radiative Forcing in the Chilean Central Andes Measured by In Situ and Remote Sensing Data. Water, 15(18), 3198. https://doi.org/10.3390/w15183198
Flanner, M. G., Arnheim, J. B., Cook, J. M., Dang, C., He, C., Huang, X., Singh, D., Skiles, S. M., Whicker, C. A., and Zender, C. S. (2021). SNICAR-ADv3: a community tool for modeling spectral snow albedo, Geosci. Model Dev., 14, 7673–7704, https://doi.org/10.5194/gmd-14-7673-2021
Genova, P., & Wei, Y. (2023). A socio-hydrological model for assessing water resource allocation and water environmental regulations in the Maipo River basin. Journal of Hydrology, 617, 129159. https://doi.org/10.1016/j.jhydrol.2023.129159
Gilardoni, S., Di Mauro, B., & Bonasoni, P. (2022). Black carbon, organic carbon, and mineral dust in South American tropical glaciers: A review. Global and Planetary Change, 213, 103837. https://doi.org/10.1016/j.gloplacha.2022.103837.
Gul, C., Mahapatra, P. S., Kang, S., Singh, P. K., Wu, X., He, C., Kumar, R., Rai, M., Xu, Y. & Puppala, S. P. (2021). Black carbon concentration in the central Himalayas: Impact on glacier melt and potential source contribution. Environmental Pollution, 275, 116544. https://doi.org/10.1016/j.envpol.2021.116544
Gulev, S.K., P.W. Thorne, J. Ahn, F.J. Dentener, C.M. Domingues, S. Gerland, D. Gong, D.S. Kaufman, H.C. Nnamchi, J. Quaas, J.A. Rivera, S. Sathyendranath, S.L. Smith, B. Trewin, K. von Schuckmann, and R.S. Vose, 2021: Changing State of the Climate System. In Climate Change 2021: The Physical Science Basis. Contribution of Working Group I to the Sixth Assessment Report of the Intergovernmental Panel on Climate Change [Masson-Delmotte, V., P. Zhai, A. Pirani, S.L. Connors, C. Péan, S. Berger, N. Caud, Y. Chen, L. Goldfarb, M.I. Gomis, M. Huang, K. Leitzell, E. Lonnoy, J.B.R. Matthews, T.K. Maycock, T. Waterfield, O. Yelekçi, R. Yu, and B. Zhou (eds.)]. Cambridge University Press, Cambridge, United Kingdom and New York, NY, USA, pp. 287–422. https://doi.org/10.1017/9781009157896.004
Hall, D. K., Riggs, G. A., & Salomonson, V. V. (1995). Development of methods for mapping global snow cover using moderate resolution imaging spectroradiometer data. Remote sensing of Environment, 54(2), 127-140. https://doi.org/10.1016/0034-4257(95)00137-P
Hu, Z., Kang, S., Li, X., Li, C., & Sillanpää, M. (2020). Relative contribution of mineral dust versus black carbon to Third Pole glacier melting. Atmospheric Environment, 223, 117288. https://doi.org/10.1016/j.atmosenv.2020.117288
Kang, S., Zhang, Y., Qian, Y., & Wang, H. (2020). A review of black carbon in snow and ice and its impact on the cryosphere. Earth-science reviews, 210, 103346. https://doi.org/10.1016/j.earscirev.2020.103346
Konya, K., Yamaguchi, M., Takigawa, M., Miyakawa, T., & O’Neel, S. (2021). Mass concentration and origin of black carbon in spring snow on glaciers in the Alaska Range. Polar Science, 27, 100572. https://doi.org/10.1016/j.polar.2020.100572
Lapere, R., Huneeus, N., Mailler, S., Menut, L., & Couvidat, F. (2022). Meteorological export and deposition fluxes of black carbon on glaciers of the central Chilean Andes. Atmospheric Chemistry and Physics Discussions, 2022, 1-32. https://doi.org/10.5194/acp-23-1749-2023
Lee, W. Y., Gim, H. J., & Park, S. K. (2024). Parameterizations of snow cover, snow albedo and snow density in land surface models: a comparative review. Asia-Pacific Journal of Atmospheric Sciences, 60(2), 185-210. https://doi.org/10.1007/s13143-023-00344-2
Liang, S. (2001). Narrowband to broadband conversions of land surface albedo I: Algorithms. Remote sensing of environment, 76(2), 213-238. https://doi.org/10.1016/S0034-4257(00)00205-4
Lin, X., Wu, S., Chen, B., Lin, Z., Yan, Z., Chen, X., Yin, G., You, D., Wen, J., Liu, Q., Xiao, Q., Liu, Q & Lafortezza, R. (2022). Estimating 10-m land surface albedo from Sentinel-2 satellite observations using a direct estimation approach with Google Earth Engine. ISPRS Journal of Photogrammetry and Remote Sensing, 194, 1-20. https://doi.org/10.1016/j.isprsjprs.2022.09.016
Liu, K., Wang, C., Hou, S., Wu, S. Y., Pang, H., Zhang, W., Wang, Y; Schwikowski, M; Jenk, T; Zou, X., Yu, J; An, C & Song, J. (2023). A high-resolution refractory black carbon (rBC) record since 1932 deduced from the Chongce ice core, Tibetan plateau. Atmospheric Environment, 294, 119480.
Mattar, C., Fuster, R., & Perez, T. (2022). Application of a cloud removal algorithm for snow-covered areas from daily MODIS imagery over Andes Mountains. Atmosphere, 13(3), 392. https://doi.org/10.3390/atmos13030392
McCarthy, M., Meier, F., Fatichi, S., Stocker, B. D., Shaw, T. E., Miles, E., … & Pellicciotti, F. (2022). Glacier contributions to river discharge during the current Chilean megadrought. Earth’s Future, 10(10), e2022EF002852. https://doi.org/10.1029/2022EF002852
Naegeli, K., Damm, A., Huss, M., Wulf, H., Schaepman, M., & Hoelzle, M. (2017). Cross-comparison of albedo products for glacier surfaces derived from airborne and satellite (Sentinel-2 and Landsat 8) optical data. Remote Sensing, 9(2), 110. https://doi.org/10.3390/rs9020110
Olivares-Contreras, V. A., Mattar, C., Gutiérrez, A. G., & Jiménez, J. C. (2019). Warming trends in Patagonian subantartic forest. International Journal of Applied Earth Observation and Geoinformation, 76, 51-65. https://doi.org/10.1016/j.jag.2018.10.015
Olivera-Guerra, L., Quintanilla, M., Moletto-Lobos, I., Pichuante, E., Zamorano-Elgueta, C., & Mattar, C. (2022). Water dynamics over a Western Patagonian watershed: Land surface changes and human factors. Science of the Total Environment, 804, 150221. https://doi.org/10.1016/j.scitotenv.2021.150221
Osmont, D., Wendl, I. A., Schmidely, L., Sigl, M., Vega, C. P., Isaksson, E., and Schwikowski, M. (2018) An 800-year highresolution black carbon ice core record from Lomonosovfonna, Svalbard, Atmos. Chem. Phys., 18, 12777–12795, https://doi.org/10.5194/acp-18-12777-2018
Osmont, D., Sigl, M., Eichler, A., Jenk, T. M., and Schwikowski, M. (2019) A Holocene black carbon ice-core record of biomass burning in the Amazon Basin from Illimani, Bolivia, Clim. Past, 15, 579–592, https://doi.org/10.5194/cp-15-579-2019
Panicker, A. S., Sandeep, K., Gautam, A. S., Trimbake, H. K., Nainwal, H. C., Beig, G., Bisht, D.S. & Das, S. (2021). Black carbon over a central Himalayan Glacier (Satopanth): Pathways and direct radiative impacts. Science of the Total Environment, 766, 144242. https://doi.org/10.1016/j.scitotenv.2020.144242
Pérez, T., Mattar, C., & Fuster, R. (2018). Decrease in snow cover over the Aysén river catchment in Patagonia, Chile. Water, 10(5), 619. https://doi.org/10.3390/w10050619
Picard, G., Dumont, M., Lamare, M., Tuzet, F., Larue, F., Pirazzini, R., & Arnaud, L. (2020). Spectral albedo measurements over snow-covered slopes: theory and slope effect corrections. The Cryosphere, 14(5), 1497-1517. https://doi.org/10.5194/tc-14-1497-2020
Ramanathan, V., & Carmichael, G. (2008). Global and regional climate changes due to black carbon. Nature geoscience, 1(4), 221-227.https://doi.org/10.1038/ngeo156
Ren, S., Jia, L., Miles, E. S., Menenti, M., Kneib, M., Shaw, T. E., Pascal, B., McCarthy, M.J., Yang, W., Pellicciotti, F & Yao, T. (2024). Observed and projected declines in glacier albedo across the Third Pole in the 21st century. One Earth, 7(9), 1587-1599. https://doi.org/10.1016/j.oneear.2024.08.010
Réveillet, M., Dumont, M., Gascoin, S., Lafaysse, M., Nabat, P., Ribes, A., … & Ginoux, P. (2022). Black carbon and dust alter the response of mountain snow cover under climate change. Nature communications, 13(1), 5279. https://doi.org/10.1038/s41467-022-32501-y
Rowe, P. M., Cordero, R. R., Warren, S. G., Stewart, E., Doherty, S. J., Pankow, A., … & Neshyba, S. (2019). Black carbon and other light-absorbing impurities in snow in the Chilean Andes. Scientific reports, 9(1), 4008. https://doi.org/10.1038/s41598-019-39312-0
Sandeep, K., Panicker, A. S., Gautam, A. S., Beig, G., Gandhi, N., Sanjeev, S., Shankar, R., & H.C. Nainwal. (2022). Black carbon over a high altitude Central Himalayan Glacier: Variability, transport, and radiative impacts. Environmental Research, 204, 112017. https://doi.org/10.1016/j.envres.2021.112017
Shaw TE, Ulloa G, Farías-Barahona D, Fernandez R, Lattus JM, McPhee J. Glacier albedo reduction and drought effects in the extratropical Andes, 1986–2020. Journal of Glaciology. 2021;67(261):158-169. https://doi.org/10.1017/jog.2020.102
Sigl, M., Abram, N. J., Gabrieli, J., Jenk, T. M., Osmont, D., and Schwikowski, M.: 19th century glacier retreat in the Alps preceded the emergence of industrial black carbon deposition on high-alpine glaciers, The Cryosphere, 12, 3311–3331,https://doi.org/10.5194/tc-12-3311-2018.
Traversa, G., Fugazza, D., Senese, A., & Frezzotti, M. (2021). Landsat 8 OLI broadband albedo validation in Antarctica and Greenland. Remote Sensing, 13(4), 799. https://doi.org/10.3390/rs13040799
Wang, M., Xu, B., Wang, H., Zhang, R., Yang, Y., Gao, S., Tang, X & Wang, N. (2021). Black carbon deposited in Hariqin Glacier of the Central Tibetan Plateau record changes in the emission from Eurasia. Environmental Pollution, 273, 115778. https://doi.org/10.1016/j.envpol.2020.115778
Wendl, I. A., Menking, J. A., Färber, R., Gysel, M., Kaspari, S. D., Laborde, M. J. G., & Schwikowski, M. (2014). Optimized method for black carbon analysis in ice and snow using the Single Particle Soot Photometer. Atmospheric Measurement Techniques, 7(8), 2667-2681. https://doi.org/10.5194/amt-7-2667-2014
Xu, H., Ren, Y. A., Zhang, W., Meng, W., Yun, X., Yu, X, Y., Li, J., Zhang, Y., Shen, G., Ma, J., Li, B., Cheng, H., Wang, X., Wan & Tao, S. (2021). Updated global black carbon emissions from 1960 to 2017: improvements, trends, and drivers. Environmental Science & Technology, 55(12), 7869-7879. https://doi.org/10.1021/acs.est.1c03117
Zhang, Y., Gao, T., Kang, S., Sprenger, M., Tao, S., Du, W., Yang, J., Wang, F & Meng, W. (2020). Effects of black carbon and mineral dust on glacial melting on the Muz Taw glacier, Central Asia. Science of The Total Environment, 740, 140056. https://doi.org/10.1016/j.scitotenv.2020.140056
Zhang, Z., Zhou, L., & Zhang, M. (2024). Modeling study of the snow darkening effect by black carbon deposition over the Arctic during the melting period. EGUsphere, 2024, 1-26. https://doi.org/10.5194/egusphere-2024-1717
Publisher’s Note
The statements, opinions, and data contained in all publications are solely those of the individual author(s) and contributor(s) and not of Recent Advances S.L. and/or the editor(s). Recent Advances S. L. and/or the editor(s) disclaim responsibility for any injury to people or property resulting from any ideas, methods, instructions, or products referred to in the content.