


Methodology for burned areas delimitation and fire severity assessment using Sentinel-2 data. A case study of forest fires occurred in Spain between 2018 and 2023
Jose A. Sobrino

1*, 
Rafael Llorens
1, Cristina Fernández
2, José M. Fernández-Alonso
2, José Antonio Vega
2- Global Change Unit, Image Processing Laboratory, University of Valencia, Paterna, 46980, Spain.
- Centro de Investigación Forestal de Lourizán, Xunta de Galicia, Pontevedra, E-36156, Spain
* Author to whom correspondence should be addressed.


Abstract
The objective of this article was to develop a methodology for the burned areas delimitation and f ire severity assessment in forest fires occurred in Spain between 2018 and 2022. As input data, this study was based on the use of Sentinel-2 spectral indices, which are characterized by having spectral bands in the near-infrared (NIR) and short-wave infrared (SWIR) spectral regions, allowing a high distinction between burned and unburned areas, and between different fire severity degrees too. All possible combinations between Sentinel-2 bands applied to a spectral normalized difference index (SP) were analyzed, along with the most commonly used burn spectral indices in remote sensing as the Burned Area Index (BAI), the Burned Area Index for Sentinel-2 (BAIS2), the Mid-Infrared Burn Index (MIRBI), the Normalized Burn Ratio (NBR), the Relativized Burn Ratio (RBR) and the relative differential Normalized Burn Ratio (RdNBR). In addition, in order to delete confusions between burned area and the presence of other land cover areas, the Sentinel-2 Global Land Cover (S2GLC 2017) and the temporal differences between pre-fire and post-fire dates were obtained for each spectral index (dSP). The results were compared by: in the case of burned areas, the Emergency Mapping Service (EMS) and the Galicia forest service; in the case of fire severity, using field plots classified as in Ruiz-Gallardo et al. (2004) study (null, low, moderate and high severity). The final statistic results obtained showed that the dNBR2 spectral index (using B11 and B12 Sentinel-2 spectral bands) provided the highest results of burned area delimitation (7% of commission error and 3% omission error, respectively) whereas, the combination of the BAIS2, the NBR and the modified Normalized Burn Ratio (NBR2, using B7 and B12 Sentinel-2 spectral bands), used in areas with low, mix and full vegetation respectively, provided the highest results in fire severity assessment (kappa statistic, F1-score and Balanced Accuracy equal to 0.87, 0.86 and 0.92, respectively). The methodology developed in this work allows obtaining accurate maps of burned area and fire severity in Spain, contributing to the reinforcement of national forest fires statistics.Keywords
Forest fires, Sentinel-2, burned area, fire severity, field plots1. Introduction
Over the last decades, forest fires have become an environmental problem with serious ecological, economic and social effects (Pausas & Keeley, 2019). Although it is a global challenge, in a specifically vulnerable country like Spain and in a scenario of climate change (Sobrino et al., 2024), it is particularly serious (Picos et al., 2019). Moreover, the size and number of forest fires are not the only variables to be considered. Fire severity is also a crucial variable, providing information of how fire intensity affected ecosystems (Keeley, 2009). In this study, fire severity is defined as the different damages observed (ecological, geophysical, atmospheric, …) after a forest fire happened (Simard, 1991; Ruiz-Gallardo, Castaño & Calera, 2004).
In order to analyze forest fires, remote sensing has established itself as a technique to monitor burned areas (regardless of the fire size). In contrast to the old techniques of forest fire analysis, which used handmade maps, remote sensing allows the detection of burned areas and fire severity in a reliable, fast and easy procedure (Chuvieco et al., 2003; Key & Benson, 2006). In this sense, the development of methodologies that allow an improvement in burned area estimation represents an achievement in research future lines (Pereira et al., 1997; Justice et al., 1993). However, remote sensing techniques also have limitations, that should be highlighted, such as the presence of clouds in the study area or the reliability decrease in areas with very heterogeneous land cover, the solution to which is conditioned by fieldwork validations (Arellano et al., 2017; Soverel et al., 2010).
Most methods which estimate burned area and fire severity from remote sensing, have been carried out using post-fire imagery alone or in comparison with pre-fire imagery (change detection) (Sobrino et al., 2019). Several authors proposed methodologies based on supervised and unsupervised classification techniques (Chuvieco & Congalton, 1988; Sunar & Özkan, 2001; Bar, Parida & Pandey, 2020). Despite having achieved positive results, practically, it is impossible to implement these tecniques for high dimensions and huge samples and, in the presence of outliers, the outcome varies greatly. In this context, thresholding techniques using spectral indices, defined as combinations of sensor bands, are positioned as an interesting tool due to be an effective and simplest technique and having a close relationship between combustion processes and reflectance variations in visible, near-infrared and mid-infrared spectrum (0,4 – 8 µm). These variations are most clearly observed in the near infrared (NIR) and shortwave infrared (SWIR) regions, where a decrease in the NIR means a decrease in chlorophyll (disappearance of vegetation) and an increase in the SWIR means a decrease in soil moisture (Key & Benson, 2006; White et al., 1996). On the basis of the variations between the NIR and SWIR regions, there is a remarkable group of spectral indices specifically designed to analyses burned areas and fire severity: the Burned Area Index (BAI) (Martín, 1998), the Burned Area Index for Sentinel-2 (BAIS2) (Filipponi, 2018), the Mid-Infrared Burn Index (MIRBI) (Trigg & Flasse, 2001), the Normalized Burn Ratio (NBR) (Key & Benson, 2006), the Relativized Burn Ratio (RBR) (Parks et al., 2014) and relative differential Normalized Burn Ratio (RdNBR) (Miller & Thode, 2007). Relativized versions of dNBR, as RBR and RdNBR spectral indices, were designed to detect changes even when pre-fire vegetation condition was low (Parks, Dillon & Miller, 2014). In this sense, it is crucial to consider the existing pre-fire vegetation density in order to improve the fire severity assessment in areas with heterogeneous vegetation (García-Llamas et al., 2019; Zald & Dunn, 2018; Miller & Thode, 2007). Popular institutions, as the United States Geological Survey (USGS) which goal is to understand the causes, consequences, and benefits of forest fires, works with Landsat satellites and dNBR index in order to assess burned areas and fire severity.
The study proposed by Balsak & San in 2023, described the advantages and disadvantages found in the use of high (higher detail but lower number of images) and low (lower detail but higher number of images) spatial resolution sensors. Despite the existence of a number of sensors widely used for forest fire analysis (Chu & Guo, 2014), the Copernicus MultiSpectral Instrument (MSI) onboard Sentinel-2 satellite, gives a high-resolution optical observation over global surfaces provided by the European Space Agency (ESA) (Fletcher, 2012). In addition, with a revisit time of 5 days (considering both satellites: Sentinel 2A and Sentinel-2B), MSI sensor allows the possibility to assess forest fires damages using the red-edge domain which is considered as a great descriptor of chlorophyll content (Korets et al., 2010; Curran et al., 1990; Fernández-Manso et al., 2016; Navarro et al., 2017). This allows comparing the most popular spectral indices designed for forest fires with spectral indices obtained from the MSI red-edge spectral bands.
The methodology presented on this article brings the innovation of jointly assessing burned area and fire severity using high spatial resolution imagery and considering the existing pre-fire vegetation density, in terms of fire severity, based on forest fires occurred in Spain between 2018-2022. The study objectives were structured in the following steps: i) assess the spectral indices obtained from Sentinel-2 images and to define the optimal thresholds, both for the study of burned area and fire severity, based on a statistical analysis and considering the pre-fire vegetation condition; ii) develop a methodology to provide accurate burned areas and fire severity maps.
2. Materials
2.1 Reference data
The reference data used in this study is divided in two parts. On the one hand, for burned areas delimitation the Emergency Mapping Service (EMS) and the Galicia forest service, provide and accuracy burned areas delimitation datasets obtained by the combination of GPS measurements and remote sensing data with high spatial resolution (in this case, Pléiades-1 A/B, SPOT 6/7 and Sentinel-2AB, with a pixel size of 0.5, 1.5 and 10 meters, respectively). On the other hand, fire severity was validated by field plots (20×20 m, equal to Sentinel-2 spatial resolution) classified by visual analysis as in Ruiz-Gallardo et al., 2004 study, which assess the fire severity on the basis of burned vegetation percentages (Ryan and Noste, 1985). Of the 34 forest fires analyzed, there were 5 where only the burned area was studied, 12 where only the fire severity was studied and 17 where both were studied. Table 1 shows the percentage of burned vegetation for each field fire severity class; Table 2 shows the fire date extinction, the dates of field fire severity and the number of plots for each field fire severity class. The fire extinction dates were provided by European Forest Fires System (EFFIS) which updates burned areas information two times every day, using the Moderate Resolution Imaging Spectroradiometer (MODIS) daily images, at 250 meters of spatial resolution, and information from the CORINE Land Cover; Figure 1 shows an example of field plots sampling in Pedro Bernardo wildfire.
Table 1: Percentage of burn vegetation and brief description (for each field fire severity class), based on Ruiz-Gallardo et al. (2004) study.
| Field fire severity class | Percentage of burn vegetation | Description |
| Null severity | Global vegetation ≈ 0 % | No effects on vegetation |
| Low | 0 % ≤ Global vegetation ≤ 50 % 0 % ≤ Tree canopy ≤ 30 % | – Shrub canopy specially affected by the fire – Some trees may be just scorched on the stem base or even intact |
| Moderate | 50 % ≤ Global vegetation ≤ 90 % 30 % ≤ Tree canopy ≤ 75 % | Most or all of the shrub canopy may have been killed |
| High | Global vegetation ≥ 90 % | Mostly killed vegetation |
Table 2: Fire date extinction (provided by European Forest Fires System, EFFIS), field burn vegetation severity plots dates and the number of plots for each field fire severity class.
| Community | Place name | Fire extinction date | Field fire plots date | Number of field plots |
| Andalucía | Nerva | 02/08/2018 | 04/10/2018 | 9 – High severity plots |
| Estepona | 12/09/2021 | 21/10/2021 22/10/2021 | 5 – Null severity plots 1 – Low severity plots 25 – High severity plots | |
| Almonaster | 01/09/2020 | – | – | |
| Castilla La Mancha | Barchín del Hoyo | 31/07/2019 | 12/08/2019 | 2 – Null severity plots 1 – Low severity plots 3 – Moderate severity plots 2 – High severity plots |
| Hellín | 25/07/2021 | 18/08/2021 19/08/2021 | 1 – Low severity plots 2 – Moderate severity plots 8 – High severity plots | |
| Castilla y León | Pedro Bernardo | 28/06/2019 | 02/08/2019 | 18 – Null severity plots 1 – Low severity plots 5 – Moderate severity plots 25 – High severity plots |
| Real Sitio de San Ildefonso | 04/08/2019 | 05/09/2019 | 9 – Null severity plots 2 – Low severity plots 12 – Moderate severity plots 29 – High severity plots | |
| Navalacruz | 20/08/2021 | 16/09/2021 17/09/2021 | 2 – Null severity plots 3 – High severity plots | |
| Zamora | 24/06/2022 | 15/07/2022 | 5 – Null severity plots 3 – Low severity plots 12 – Moderate severity plots 24 – High severity plots | |
| Comunitat Valenciana | Luchente | 08/08/2018 | – | – |
| Bejís | 29/10/2020 | – | – | |
| Vall d’Ebo | 19/08/2022 | – | – | |
| Extremadura | Cabezuela del Valle | 03/09/2020 | – | – |
| Galicia | Flariz | 24/07/2020 | 31/07/2020 27/08/2020 | 5 – Null severity plots 1 – Low severity plots 8 – Moderate severity plots 14 – High severity plots |
| San Millao | 29/07/2020 | 04/08/2020 03/09/2020 10/09/2020 | 5 – Null severity plots 11 – Moderate severity plots 24 – High severity plots | |
| Verín* | 22/07/2020 04/08/2022 | 09/09/2020 22/08/2022 23/08/2022 | 9 – Null severity plots 15 – Moderate severity plots 13 – High severity plots | |
| Lobios | 12/09/2020 | 21/09/2020 28/09/2020 | 2 – Null severity plots 1 – Low severity plots 7 – Moderate severity plots 11 – High severity plots | |
| Vilariño | 13/09/2020 | 22/09/2020 | 1 – Null severity plots 3 – Moderate severity plots 8 – High severity plots | |
| Cualedro | 13/09/2020 | 25/09/2020 26/09/2020 | 2 – Null severity plots 1 – Low severity plots 3 – Moderate severity plots 5 – High severity plots | |
| Chandrexa | 13/09/2020 | 29/09/2020 | 1 – Null severity plots 5 – High severity plots | |
| Cernado | 14/09/2020 | 29/09/2020 | 1 – Null severity plots 1 – Low severity plots 4 – High severity plots | |
| Cadavos | 14/09/2020 | 30/09/2020 | 2 – Moderate severity plots 4 – High severity plots | |
| Arbo | 31/07/2022 | 22/08/2022 | 2 – Moderate severity plots 4 – High severity plots | |
| Baltar | 06/08/2022 | 16/08/2022 | 1 – Null severity plots 1 – Low severity plots 4 – Moderate severity plots | |
| Boiro | 06/08/2022 | 10/08/2022 12/08/2022 | 2 – Null severity plots 5 – Low severity plots 10 – Moderate severity plots 7 – High severity plots | |
| Carballeda de Valdeorras | 22/07/2022 | 02/08/2022 03/08/2022 | 1 – Low severity plots 14 – Moderate severity plots 58 – High severity plots | |
| Folgoso do Courel | 23/07/2022 | 27/07/2022 28/07/2022 29/07/2022 04/08/2022 | 7 – Null severity plots 2 – Low severity plots 25 – Moderate severity plots 64 – High severity plots | |
| Irixo | 11/08/2022 | 29/08/2022 | 1 – Null severity plots 1 – Moderate severity plots 6 – High severity plots | |
| Laza-Chandrexa | 15/08/2022 | 18/08/2022 | 3 – High severity plots | |
| Lobeira | 26/08/2022 | 06/09/2022 | 1 – Moderate severity plots 2 – High severity plots | |
| Oimbra-Rabal | 21/07/2022 | 18/08/2022 23/08/2022 | 1 – Null severity plots 3 – Low severity plots 9 – Moderate severity plots 2 – High severity plots | |
| Oimbra-Videferre | 19/07/2022 | 23/08/2022 | 1 – Null severity plots 2 – Moderate severity plots 1 – High severity plots | |
| Vilariño de Conso | 24/07/2022 | 18/08/2022 | 1 – Low severity plots 2 – Moderate severity plots | |
| Navarra | San Martín | 21/06/2022 | – | – |
| Global | – | – | – | 80 – Null severity plots 26 – Low severity plots 153 – Moderate severity plots 360 – High severity plots 619 plots – Total |
*Two forest fires occurred in the same area but in different years (July, 2020; August, 2022)


Figure 1: Example of fire severity field plots sampling in Real Sitio de San Ildefonso forest fire. Green colour corresponds to null severity, yellow to low, orange to moderate and red to high. The reference coordinate system is WGS84 (EPSG: 4326).
2.2. Sentinel-2 data
The MSI sensor aboard the Sentinel-2 satellite is characterized by having 13 spectral bands in different spatial resolutions (10, 20 and 60 m) as shown in Table 3. All the images used have been downloaded from the ESA portal and are Level 2A reflectance images (bottom of atmosphere or BOA, which are atmospherically corrected) derived from the associated Level-1C products. Table 4 shows the Sentinel-2 acquisition date for all the images used in this study. To avoid seasonal changes in vegetation that could be falsely detected as a burnt area, a limited time lag between images should be considered. In most cases, two post-fire images from different dates were used, since the fire extinction and the field fire severity date were different.
Table 3: Sentinel-2 bands with their respective central wavelengths and spatial resolutions. In bold font the spectral bands used in this study.
| Sentinel-2 Bands | Central Wavelength (μm) | Resolution (m) |
| B1 – Coastal aerosol | 0.433 | 60 |
| B2 – Blue | 0.490 | 10 |
| B3 – Green | 0.560 | 10 |
| Band 4 – Red | 0.665 | 10 |
| B5 – Vegetation Red Edge | 0.705 | 20 |
| B6 – Vegetation Red Edge | 0.740 | 20 |
| B7 – Vegetation Red Edge | 0.783 | 20 |
| B8 – NIR | 0.842 | 10 |
| B8A – Vegetation Red Edge | 0.865 | 20 |
| B9 – Water Vapour | 0.945 | 60 |
| B10 – SWIR – Cirrus | 1.375 | 60 |
| B11 – SWIR 1 | 1.610 | 20 |
| B12 – SWIR 2 | 2.190 | 20 |
Table 4: Sentinel-2 acquisition date of all images used in this study.
| Community | Place name | Pre-fire date | Post-fire date (burned area) | Post-fire date (fire severity) |
| Andalucía | Nerva | 31/07/2018 | 15/08/2018 | 4/10/2018 |
| Estepona | 08/09/2021 | 18/09/2021 | 20/10/2021 | |
| Almonaster | 24/08/2020 | 03/09/2020 | 03/09/2020 | |
| Castilla La Mancha | Barchín del Hoyo | 30/07/2019 | 02/08/2018 | 12/08/2019 |
| Hellín | 22/07/2021 | 27/07/2021 | 20/09/2021 | |
| Castilla y León | Pedro Bernardo | 01/06/2019 | 01/07/2019 | 31/07/2019 |
| Real Sitio de San Ildefonso | 02/08/2019 | 25/08/2019 | 06/09/2019 | |
| Navalacruz | 09/08/2021 | 24/08/2021 | 08/09/2021 | |
| Zamora | 10/06/2022 | 25/06/2022 | 15/07/2022 | |
| Comunitat Valenciana | Luchente | 04/08/2018 | 24/08/2018 | 24/08/2018 |
| Bejís | 08/08/2022 | 23/08/2022 | 23/08/2022 | |
| Vall d’Ebo | 08/08/2022 | 07/09/2022 | 07/09/2022 | |
| Extremadura | Cabezuela del Valle | 19/08/2020 | 03/09/2020 | 03/09/2020 |
| Galicia | San Millao | 28/07/2020 | 07/08/2020 | 07/08/2020 01/09/2020 11/09/2020 |
| Verín | 18/07/2020 | 28/07/2020 | 11/09/2020 | |
| Lobios | 11/09/2020 | 29/09/2020 | 29/09/2020 | |
| Vilariño | 11/09/2020 | 11/10/2020 | 11/10/2020 | |
| Cualedro | 11/09/2020 | 21/09/2020 | 21/09/2020 | |
| Chandrexa | 11/09/2020 | 11/10/2020 | 11/10/2020 | |
| Cernado | 11/09/2020 | 11/10/2020 | 11/10/2020 | |
| Cadavos | 11/09/2020 | 11/10/2020 | 11/10/2020 | |
| Arbo | 23/07/2022 | 02/08/2022 | 22/08/2022 | |
| Baltar | 02/08/2022 | 07/08/2022 | 20/08/2022 | |
| Boiro | 31/07/2022 | 10/08/2022 | 10/08/2022 | |
| Carballeda de Valdeorras | 08/07/2022 | 23/07/2022 | 02/08/2022 | |
| Folgoso do Courel | 08/07/2022 | 23/07/2022 | 02/08/2022 | |
| Irixo | 07/08/2022 | 12/08/2022 | 22/08/2022 | |
| Laza-Chandrexa | 02/08/2022 | 22/08/2022 | 22/08/2022 | |
| Lobeira | 22/08/2022 | 27/08/2022 | 09/09/2022 | |
| Oimbra-Rabal | 13/07/2022 | 23/07/2022 | 22/08/2022 | |
| Oimbra-Videferre | 13/07/2022 | 23/07/2022 | 22/08/2022 | |
| Vilariño de Conso | 08/07/2022 | 02/08/2022 | 22/08/2022 | |
| Navarra | San Martín | 28/05/2022 | 02/07/2022 | 02/07/2022 |
3. Methodology
3.1. Flowchart
The methodology, proposed on this article, is shown in Figure 2 flowchart and it is structured in different steps: a) forest fires selection inside study area; (b) download, pre-processing and spectral index calculation of Sentinel-2 images related to forest fires study area; (c) reference data collection (burned area: EMS/GPS; fire severity: field plots); (d) statistical analysis (omission and commission errors; kappa statistic, F1-score, Accuracy and Balanced Accuracy); (e) final maps provided by spectral indices with highest accuracy obtained in statistical analysis step. All steps represented in the Figure 2 flowchart are described in detail in the following sub-sections.


Figure 2: Overall flowchart steps followed in this study.
3.2. Study area
The work that is described was carried out in 34 forest fires occurred in Spain between 2018 and 2022, being 32 of them large fires (> 500 Ha). Those fires burned over 115,000 Ha, classified mainly as Pinus sylvestris L, Pinus pinea L., Pinus pinaster Ait., Pinus radiata, Pinus nigra, Populus x canadensis, Populus nigra, Quercus pyrenaica, Quercus ilex, Quercus suber, Acacia dealbata, Alnus glutinosa, Fraxinus angustifolia, Juniperus oxycedrus, Juniperus communis, Castanea sativa, Salix spp., Olea europaea, Arbutus unedo, Eucalyptus nitens, Eucalyptus camaldulensis and Eucalyptus globulus Labill. with a shrubby understory of Erica L. sp., Cistus L. sp., and Cytisus Desf. Sp. The study area has an elevation range between 70 and 2100 m a.s.l. and slopes between 0% and 85%. The forest fires studied are stratified in two main different climate regions: Mediterranean climate, with 2–3 months of summer drought, has rainy winters (mean precipitation equal to 100 mm,), and dry and hot summers (mean temperatures and rainfall round 22 °C and 35 mm, respectively); Atlantic climate has abundant rainfall (> 750 mm) with average annual temperatures ranging from 13 °C in hilly regions to 11 °C on the coast (Costafreda-Aumedes et al., 2018). Figure 3 shows the map of Iberian Peninsula with the forest fires studied.

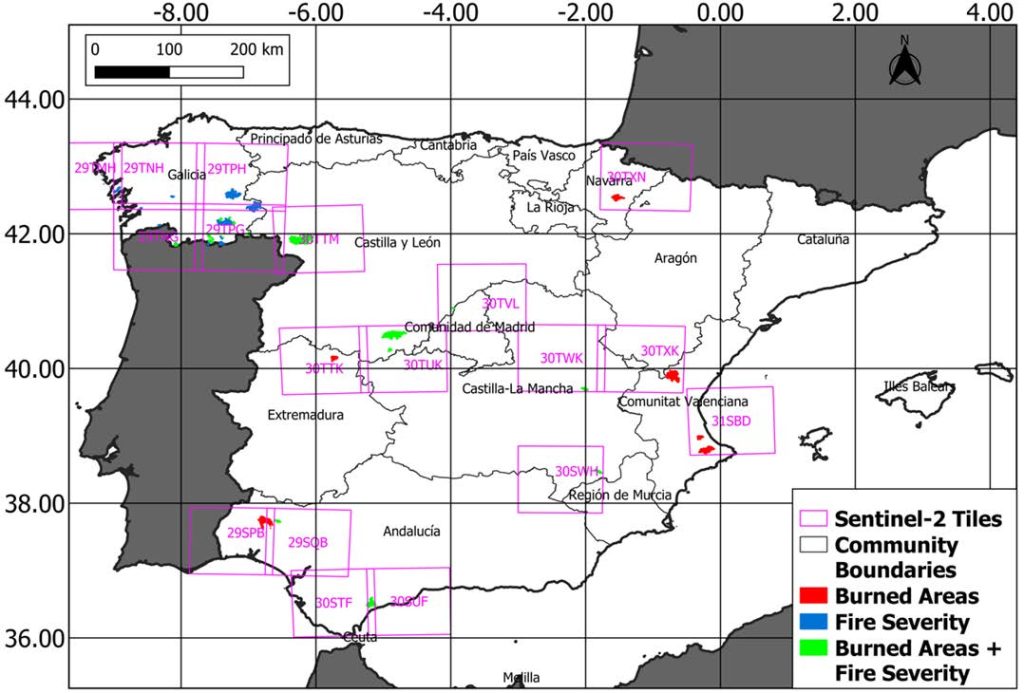
Figure 3: Map of Iberian Peninsula with the forest fires studied. In red color, forest fires that only burned areas were studied; in blue color, forest fires that only fire severity were studied; in green color, forest fires that both burned area and fire severity were studied. Pink color boxes represent Sentinel-2 tiles used in this study. The reference coordinate system is WGS84 (EPSG: 4326).
3.3. Preprocessing
All Sentinel-2 bands used on this study have been resampled (from 10 to 20 meters) and cropped, as close as possible to the study area, in order to reduce the processing time. Despite having checked for the presence of clouds prior to downloading images, it ensures the removal of pixels classified as clouds using the Scene Classification Image (SCL) mask (Richter & Schläpfer, 2005). In addition to the cloud correction, since this study focuses on forest fires occurring on forest cover, the Sentinel-2 Global Land Cover (S2GLC 2017) was used in aim to remove all areas corresponding to other land cover types (Malinowski et al., 2020). Figure 4, shows the S2GLC 2017 for the Nerva forest fire (Andalucía, August 2018).


Figure 4: Sentinel-2 Global Land Cover (S2GLC 2017) focused on Nerva forest fire (Andalucía, August 2018). All classes excluding woodland (broadleaf tree cover and coniferous tree cover) and shrubland (herbaceous vegetation, moors and heathland and sclerophyllous vegetation), were eliminated. The reference coordinate system is WGS84 (EPSG: 4326.
Once pre-processing Sentinel-2 images, a discussion on the main different spectral indices directly related to forest fires, was driven in order to select those of them which showed to perform better according to literature based on their sensitivities. In the review of the most commonly used spectral indices in forest fires, it was noted that most of these indices employ a normalized difference algorithm (i.e. the subtraction of two bands reflectivity divided by the sum of those same bands reflectivity), being the only difference the combination of bands used (Chuvieco et al., 2006; Fernández-Manso et al., 2016). For this reason, all possible combinations of normalized difference spectral indices (SP) were calculated from the Sentinel-2 bands (Table 3) with a view to obtain the combination that best estimates burned area and fire severity. In addition, considering burned areas as an environment change, a change detection technique using the temporal differences between pre-fire and post-fire dates were obtained for each spectral index (Table 5).
Table 5: Spectral indices for burned areas delimitation and fire severity assessment; the difference between pre and post-fire images were applied in this study.
| Spectral Index | Algorithm* | References |
| differential Burned Area Index (dBAI) | | Chuvieco & Martín, 1998 |
| differential Burned Area Index for Sentinel-2 (dBAIS2) | | Filipponi, 2018 |
| differential Mid-Infrared Burn Index (dMIRBI) | | Trigg & Flasse, 2001 Tran et al., 2018. |
| differential Normalized Burn Ratio (dNBR) | | Key & Benson, 2006 |
| Relativized Burn Ratio (RBR) | | Parks et al., 2014 |
| relative differential Normalized Burn Ratio (RdNBR) | | Miller & Thode, 2007 |
| Normalized difference spectral indices** | | Delegido et al., 2018 |

![\[\text{BAI} = \frac{1}{(0.1 - B4)^2 + (0.06 - B8)^2}\]](https://www.recentadvancesin.com/wp-content/ql-cache/quicklatex.com-2bdce5d1ba019677f93831af315b76a1_l3.png "Rendered by QuickLaTeX.com")

![\[\text{dBAI} = \text{BAI}_{\text{PRE-FIRE}} - \text{BAI}_{\text{POST-FIRE}}\]](https://www.recentadvancesin.com/wp-content/ql-cache/quicklatex.com-aafea49dbbc15d263b9dda4108459890_l3.png "Rendered by QuickLaTeX.com")

![\[\text{BAIS2} = \left(1 - \sqrt{\frac{\text{B6} \cdot \text{B7} \cdot \text{B8A}}{\text{B4}}}\right) \times \left(\frac{\text{B12} - \text{B8A}}{\sqrt{\text{B12} - \text{B8A}}} + 1\right)\]](https://www.recentadvancesin.com/wp-content/ql-cache/quicklatex.com-5e30631b816081503f9aaf097c8f6547_l3.png "Rendered by QuickLaTeX.com")

![\[\text{dBAIS2} = \text{BAIS2}_{\text{PRE-FIRE}} - \text{BAIS2}_{\text{POST-FIRE}}\]](https://www.recentadvancesin.com/wp-content/ql-cache/quicklatex.com-7ca0466e132c1e54e0bed8cb792b338f_l3.png "Rendered by QuickLaTeX.com")

![\[\text{MIRBI} = 10 \times \text{B11} - 9.8 \times \text{B12}\]](https://www.recentadvancesin.com/wp-content/ql-cache/quicklatex.com-225339aee72e03deb709482f6f93dc35_l3.png "Rendered by QuickLaTeX.com")

![\[\text{dMIRBI} = \text{MIRBI}_{\text{PRE-FIRE}} - \text{MIRBI}_{\text{POST-FIRE}}\]](https://www.recentadvancesin.com/wp-content/ql-cache/quicklatex.com-6f00b1667253eaf13e446b64fe4f0dc6_l3.png "Rendered by QuickLaTeX.com")

![\[\text{NBR} = \frac{\text{B8} - \text{B12}}{\text{B8} + \text{B12}}\]](https://www.recentadvancesin.com/wp-content/ql-cache/quicklatex.com-14cc84cb83ac978090a62f0f7ea03dcd_l3.png "Rendered by QuickLaTeX.com")

![\[\text{dNBR} = \text{NBR}_{\text{PRE-FIRE}} - \text{NBR}_{\text{POST-FIRE}}\]](https://www.recentadvancesin.com/wp-content/ql-cache/quicklatex.com-0e3133fd60a040ed0ab96c59997a02b5_l3.png "Rendered by QuickLaTeX.com")

![\[\text{RBR} = \frac{\text{dNBR}}{\text{NBR}_{\text{PRE-FIRE}} + 1.001}\]](https://www.recentadvancesin.com/wp-content/ql-cache/quicklatex.com-320f3132066372871010f338406017d2_l3.png "Rendered by QuickLaTeX.com")

![\[\text{RdNBR}=\frac{\text{dNBR}}{\sqrt{\left|{\text{NBR}}_{\text{PRE}-\text{FIRE}}\right|}}\]](https://www.recentadvancesin.com/wp-content/ql-cache/quicklatex.com-30c2c7ea328a844f70adf02d005638e3_l3.png "Rendered by QuickLaTeX.com")

![\[\text{SP} = \frac{\text{B}_{\text{X}} - \text{B}_{\text{Y}}}{\text{B}_{\text{X}} + \text{B}_{\text{Y}}}\]](https://www.recentadvancesin.com/wp-content/ql-cache/quicklatex.com-212085249b302fb0b199df7a01b3d458_l3.png "Rendered by QuickLaTeX.com")

![\[\text{dSP} = \text{SP}_{\text{PRE-FIRE}} - \text{SP}_{\text{POST-FIRE}}\]](https://www.recentadvancesin.com/wp-content/ql-cache/quicklatex.com-b62d00540fdfc2f4b1660df62eff6a7d_l3.png "Rendered by QuickLaTeX.com")
*All spectral and spatial band information used is summarized in Table 4. ** Bx and By are all the different pair of Sentinel-2 bands used in this study.
3.4 Burned area delimitation
The burned area delimitation result is based on the comparison between the spectral indices exposed in Table 5 and the reference areas delimitation (see Section 2.1). In this sense, the Separability Index (SI) algorithm (Eq. 1), provided by Kaufman & Remer in 1994 and employed in many studies (Filipponi, 2018; Lasaponara, 2006; Veraverbeke, 2011; Teodoro & Amaral, 2019), was the technique used to select the most accurate spectral index.
![\[ SI = \frac{\left| \mu_b - \mu_{ub} \right|}{\sigma_b + \sigma_{ub}} \qquad (1) \]](https://www.recentadvancesin.com/wp-content/ql-cache/quicklatex.com-44bc201ff109c8a216d0177e000cedf6_l3.png "Rendered by QuickLaTeX.com")

Where μb and μub are the mean values, and σb and σub are the standard deviation values of burned and unburned areas, respectively. The higher the SI value, the higher the separability between classes, where one is the recommended minimum separability value (Fornacca et al., 2018). The required mean and standard deviation values were calculated from random plots (100 plots per fire, where 50 correspond to burned areas and 50 to unburned areas according to the reference data) in each of the forest fires analyzed. Eq. (2) represents the normalized difference spectral index selected (dNBR2 with the SI highest value) as a combination of the two sentinel SWIR bands (Band 11 and Band 12, as shown in Table 3) (Key & Benson, 2006). Table 6 shows the SI values for each spectral index, as well as the burned threshold obtained by mean and standard deviation statistics combination for both classes (burned and unburned).
![\[ \text{NBR2} = \frac{\text{B11} - \text{B12}}{\text{B11} + \text{B12}} \qquad (2) \]](https://www.recentadvancesin.com/wp-content/ql-cache/quicklatex.com-f168345d5265a4f7a514dbd4f94bead1_l3.png "Rendered by QuickLaTeX.com")

Table 6: Separability index (SI) and burned threshold extracted in all forest fires studied. The dNBR2 index was obtained as a combination of the two sentinel SWIR bands (Band 11 and Band 12, as shown in Eq. (2) and Table 3).
| Spectral index | Separability Index (SI) | Burned Threshold |
| dBAI | 1.24 | dBAI ≤ -45 |
| dBAIS2 | 1.41 | dBAIS2 ≤ -0.15 |
| dMIRBI | 1.42 | dMIRBI ≥ 0.25 |
| dNBR | 1.52 | dNBR ≥ 0.10 |
| RBR | 1.60 | RBR ≥ 0.10 |
| RdNBR | 1.20 | RdNBR ≥ 0.25 |
| dNBR2 | 1.65 | dNBR2 ≥ 0.10 |
The burned threshold column represents the value above or below which a pixel will be considered as a burned area. For example, in the case of the dNBR index, a pixel whose value is equal to or higher than 0.10 will be classified as a burned area. In addition, in order to reduce speckling and obtain a smoothed image, a low pass spatial filter (size 3×3) was applied which reduced noise but likely increased omission of smaller burned areas (Vanderhoof et al., 2021).
Using the Table 6 burned threshold, all the burned spectral indices were reclassified being burned and unburned areas pixels which values are one and zero respectively (BSI). Moreover, reference area delimitation datasets are also reclassified being burned and unburned areas pixels which values are two and zero (RAD), respectively. Finally, both perimeters are summed and interpreted following the classification in Table 7.
Table 7: Interpretation of the burned area delimitation results where BSI is the burned spectral index reclassified and RAD is the reference area delimitation dataset reclassified.
| Pixel values | Interpretation | |
| BSI + RAD = 0 | No Fire Pixels (NF) | |
| BSI + RAD = 1 | Commission Pixels (CP) | |
| BSI + RAD = 2 | Omission Pixels (OP) | |
| BSI + RAD = 3 | Coincidence Pixels (COIP) |
To analyze the accuracy of pixel values (Table 7), the Eq. (3), Eq. (4) and Eq. (5) are used. The result of Eq. (3), Eq. (4) and Eq. (5) are expressed in percentages. The coincidence area (COI) measures the BSI capacity to correctly delineation the burned area compared to the RAD. The omission area (OM) measures the pixels, which SPI detects as fire, but the RAD detects as no fire. Otherwise, the commission area (COM) measures the pixels, which BSI detects as no fire, but the RAD detects as fire.
![\[ \text{Coincidence Area } \left(\text{COI}\right)=\frac{\text{COIP}}{\text{COIP}+\text{OP}} \times 100 \qquad (3)\]](https://www.recentadvancesin.com/wp-content/ql-cache/quicklatex.com-f85923391e41f470ae61fc26b36e6d4b_l3.png "Rendered by QuickLaTeX.com")

![\[ \text{Omission Area } \left(\text{OM}\right)=\frac{\text{OP}}{\text{COIP}+\text{OP}}\times 100 \qquad (4)\]](https://www.recentadvancesin.com/wp-content/ql-cache/quicklatex.com-e3476f57253fe5cfc3b589788236cc3a_l3.png "Rendered by QuickLaTeX.com")

![\[ \text{Commission Area } \left(\text{COM}\right)=\frac{\text{CP}}{\text{COIP}+\text{OP}} \times 100 \qquad (5)\]](https://www.recentadvancesin.com/wp-content/ql-cache/quicklatex.com-cc654e37b1fb609d3928a817c05cd0c5_l3.png "Rendered by QuickLaTeX.com")

3.5 Fire severity
The fire severity result is based on the comparison between the spectral indices exposed in Table 5 and field plots classified as in Ruiz-Gallardo et al., 2004 study (Table 1). As in the case of burned area delimitation, the fire severity methodology is based on the Separability Index (SI) algorithm (Eq. (1)) but using field plots (Table 2), and adding different weights (SIw) depending on the fire severity class (the higher fire severity, the higher weight) (Tran et al., 2018). This criterion is based on the relationship between fire severity and future erosion risks, considering more important the correct distinction between high and moderate fire severity (forest structure completely damaged and, therefore, high risk of erosion) than between moderate and low fire severity (forest structure little damaged and low risk of erosion) (Tran et al., 2018). Eq. (6) shows the weights considered for each severity class.
![\[ \text{SI}_w = (\text{SI}_{\text{UB-L}} \times 0.1) + (\text{SI}_{\text{L-M}} \times 0.3) + (\text{SI}_{\text{M-H}} \times 0.6) \qquad (6)\]](https://www.recentadvancesin.com/wp-content/ql-cache/quicklatex.com-9288c667ac3365fe8320c9a4489ea2ee_l3.png "Rendered by QuickLaTeX.com")

SIUB-L, SIL-M and SIM-H are the separability index between unburned and low severity, low and moderate severity and moderate and high severity, respectively. The SIw results obtained were, in all the cases, very low (SIw less than one). Since there are studies that relate fire severity to vegetation type (Fornacca et al., 2018; Mpakairi et al., 2020; Parker et al., 2015; Picotte et al., 2011), burned area was divided according to pre-fire vegetation. This division was carried out based on Normalized Difference Vegetation Index (NDVI, Eq. (7)), prior to the fire date (Rouse et al., 1973).
![\[ \text{NDVI} = \frac{(B8 - \text{B4})}{(\text{B8} + \text{B4})} \qquad (7) \]](https://www.recentadvancesin.com/wp-content/ql-cache/quicklatex.com-676c2539a1e1183ab561b6ceb13a9716_l3.png "Rendered by QuickLaTeX.com")

Bands B8 and B4 (Eq. (7)) correspond to NIR and Red Sentinel-2 bands (Table 3). In order to divide the NDVI pre-fire image using the optimal threshold, a histogram analysis was realized (Jiménez-Muñoz et al., 2009; Sobrino et al., 2008). Figure 5, shows the pre-fire NDVI histogram divided in two peaks based on S2GLC 2017 classes: woodland (broadleaf tree cover and coniferous tree cover) and shrubland (herbaceous vegetation, moors and heathland and sclerophyllous vegetation). In the middle of two peaks, there is a region that represents areas with a combination of low and full vegetation density (B). Discontinuous red lines represent the different thresholds used: A or low density, NDVI < 0.40; B or mix density, 0.40 ≤ NDVI < 0.75; C or full density, NDVI ≥ 0.75). Figure 6, shows the pre-fire NDVI image focused on the Lobios forest fire (Table 4) classified using thresholds obtained by Figure 5 histogram.

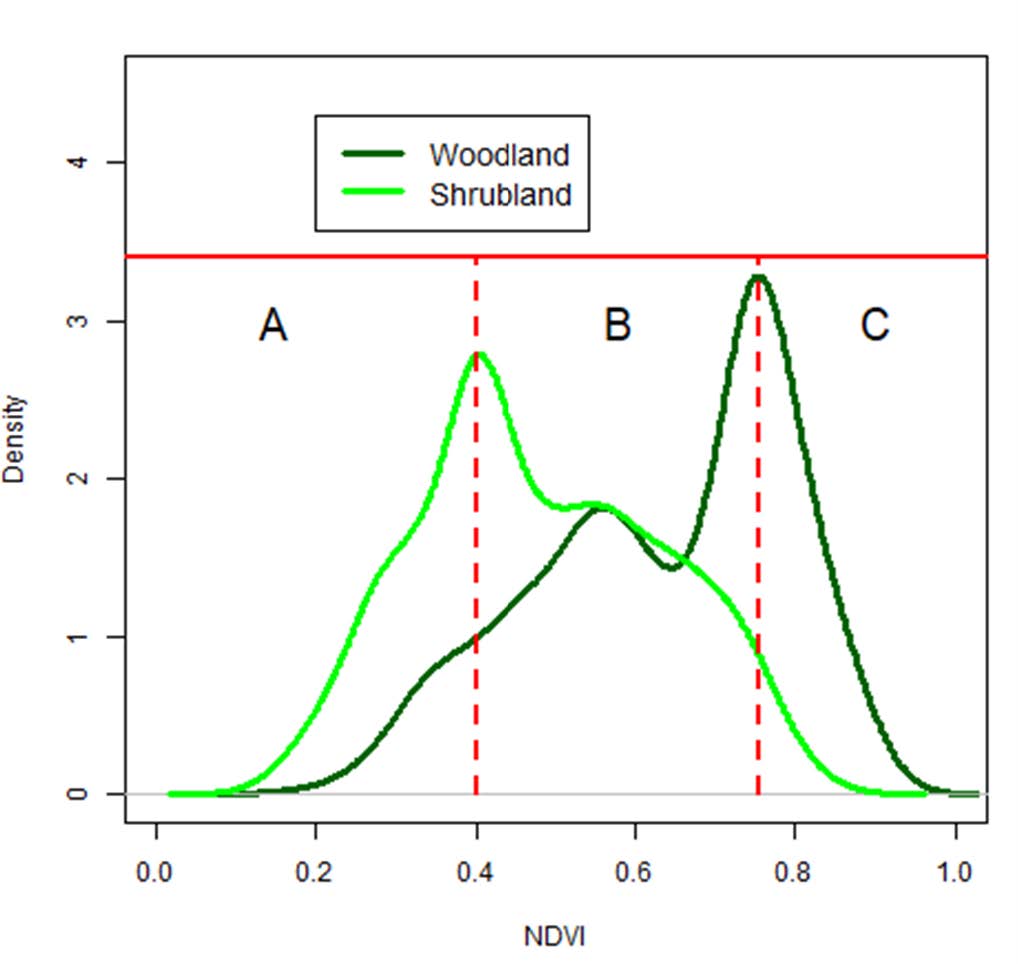
Figure 5: Pre-fire NDVI histogram divided in two peaks based on S2GLC 2017 classes: woodland (broadleaf tree cover and coniferous tree cover) and shrubland (herbaceous vegetation, moors and heathland and sclerophyllous vegetation). In the middle of two peaks, there is a region that represents areas with a combination of low and full vegetation density (B). Discontinuous red lines represent the different thresholds used: A or low density, NDVI < 0.40; B or mix density, 0.40 ≤ NDVI < 0.75; C or full density, NDVI ≥ 0.75).

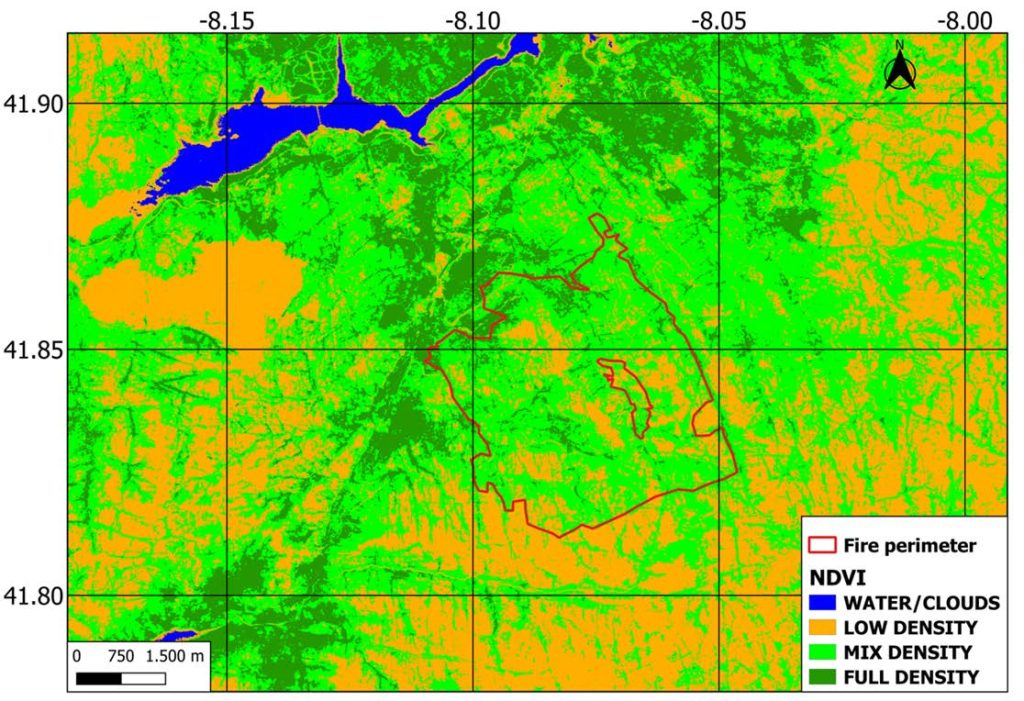
Figure 6: Pre-fire NDVI image focused on the Lobios forest fire (Table 4) classified using thresholds obtained by Figure 5b histogram. The reference coordinate system is WGS84 (EPSG: 4326).
In this context, several spectral indices obtained from the combination of post-fire bands reached SIw values higher than 1. BAIS2 index was selected for vegetation low density areas, NBR for vegetation mix density areas and NBR3 (Eq. (8)), which is similar than NBR algorithm but using the B7 red-edge band (Table 3), for vegetation full density areas.
![\[ \text{NBR3} = \frac{(\text{B7\text{-}B12})}{(\text{B7\text{+}B12})} \qquad (8)\]](https://www.recentadvancesin.com/wp-content/ql-cache/quicklatex.com-524c20d11169498ec267f371daa8d834_l3.png "Rendered by QuickLaTeX.com")

Once the spectral indices were selected as the best predictors, approximately 40% of the field plots (Table 2) were used to extract the mean and standard deviation statistics (248 plots where 32 correspond to null severity, 10 to low, 61 to moderate and 144 to high). The remaining 60% of field plots (371 plots where 48 correspond to null severity, 16 to low, 92 to moderate and 216 to high) were used for validation (omission and commission errors, accuracy, balanced accuracy, F1-score stat and kappa index) (Tharwat, 2020; Congalton, 1991; Boca & Rodríguez, 2012; Congalton & Green, 2019). Accuracy (ACC) metric, defined as a ratio between the correctly classified samples to the total number of samples, is one of the most commonly used measures for the classification performance (Tharwat, 2020). However, ACC is sensitive to the imbalanced data (as in this study where the quantity of high severity field plots is much larger than low severity). In this sense, Balanced Accuracy (BA) and F1-score (F1), considered as the harmonic mean of precision and recall, was also analyzed. Finally, the kappa index (k) was obtained to overall demonstrate the importance of inter-rater reliability, which is that it represents the level to which the data collected in the study are accurate representations of the variables tested (McHugh, 2012).
Furthermore, the results were compared with those obtained from the global methodology proposed by the United States Geological Survey (USGS), which uses the dNBR index classified according to Table 8 (Key & Benson, 2006; Lutes et al., 2006; Keeley, 2009) and performed by Landsat images. Table 8 also shows the BAIS2, NBR, NBR3 optimal thresholds as a combination of µ and σ (same procedure that burned area delimitation) and Table 9, shows the interpretation of kappa index (Landis & Koch, 1977).
Table 8: Thresholds for low, moderate and high severity, for each severity degree and for vegetation low, mix and full density areas. USGS algorithm was reclassified in the same fire severity degrees used in this study (null severity: high enhanced regrowth, low enhanced regrowth and unburned; low severity: low severity; moderate severity: moderate-low and moderate-high severity; high severity: high severity). The null severity is validated according to if the field plots are inside or outside the burned area (following the burned area delimitation thresholds obtained in Table 6).
| Fire severity Vegetation density | Low | Moderate | High |
| Low (BAIS2) | BAIS2 < 0.90 | 0.90 ≤ BAIS2 < 1 | BAIS2 ≥ 1 |
| Mix (NBR) | NBR > 0 | 0 ≥ NBR > -0.30 | NBR ≤ -0.30 |
| Full (NBR3) | NBR3 > 0.20 | 0.20 ≥ NBR3 > -0.30 | NBR3 ≤ -0.30 |
| Global (USGS) | dNBR < 0.27 | 0.27 ≤ dNBR < 0.66 | dNBR ≥ 0.66 |
Table 9: Interpretation of kappa values.
| Kappa values | Interpretation |
| < 0.00 | No agreement |
| 0.00 – 0.19 | Poor agreement |
| 0.20 – 0.39 | Fair agreement |
| 0.40 – 0.59 | Moderate agreement |
| 0.60 – 0.79 | Substantial agreement |
| 0.80 – 1.00 | Almost perfect agreement |
4. Results
The R statistical software (Team, 2021) and library “caret” (Max Kuhn, 2021), were used to perform the results analysis. Regarding burned area delimitation, Table 10 shows the burned area delimitation results for each spectral index (using burned threshold column of Table 6) where the highest values of coincidence area (COI) and the lowest values of omission area (OM) and commission area (COM) determine the suitable index to differentiate between burned and unburned areas. The results are expressed in hectares (Ha) and percentages (in parentheses). The assessment of the burned areas delimitation was carried out using Eq. (1), Eq. (2) and Eq. (3). In global sense, the results (displayed in Table 10), show the dNBR2 algorithm as the most accurate index (considering the COI, OM and COM values) to estimate burned areas (112717.96 Ha (98%), 4047.25 Ha (2%) and 7952.70 Ha (8%), respectively.
Table 10: Burned area delimitation results based on coincidence area (COI), omission area (OM) and commission area (COM), using the spectral indices summarized in Table 5 and reclassified by burned threshold values of Table 6. The results are expressed in hectares (Ha) and percentages (in parentheses).
| Spectral index | |||||||
| dBAI | dBAIS2 | dMIRBI | dNBR | RBR | RdNBR | dNBR2 | |
| Commission area (COM) | 3903.66 (4%) | 10977.97 (9%) | 8374.46 (7%) | 12433.95 (10%) | 9090.65 (8%) | 16701.23 (13%) | 7952.70 (7%) |
| Omission area (OM) | 16015.12 (14%) | 6646.04 (6%) | 6203.20 (5%) | 5064.45 (4%) | 5667.42 (5%) | 4037.06 (3%) | 4047.25 (3%) |
| Coincidence area (COI) | 100750.09 (86%) | 110119.17 (94%) | 110562.01 (95%) | 111700.76 (96%) | 111097.79 (95%) | 112728.15 (97%) | 112717.96 (97%) |
| Total Burned Area (COI + OM) | 116765.21 (100%) | ||||||
Regarding fire severity, Figure 7 show the fire severity results obtained by the methodology proposed in this study (FS) and the United States Geological Survey (USGS) methodology (using the spectral index thresholds of Table 8) where the lowest values of omission (O) and commission (C) errors and the highest value of Accuracy (ACC), Balanced Accuracy (BA), F1-score (F1) and Kappa index (k) determine the suitable index to differentiate between the different fire severity classes. The results of k are expressed by the kappa values of Table 9. FS methodology provides higher ACC, BA, F1 and k values (0.93, 0.92, 0.86 and 0.87) than USGS methodology (0.84, 0.88, 0.81 and 0.73). The fire severity class with the lowest O and C error results is null severity (O equal to 10%, and C equal 0%), respectively. On the contrary, the fire severity class with the highest O and C error results are low severity (O equal to 27%, and C equal to 43%), respectively.

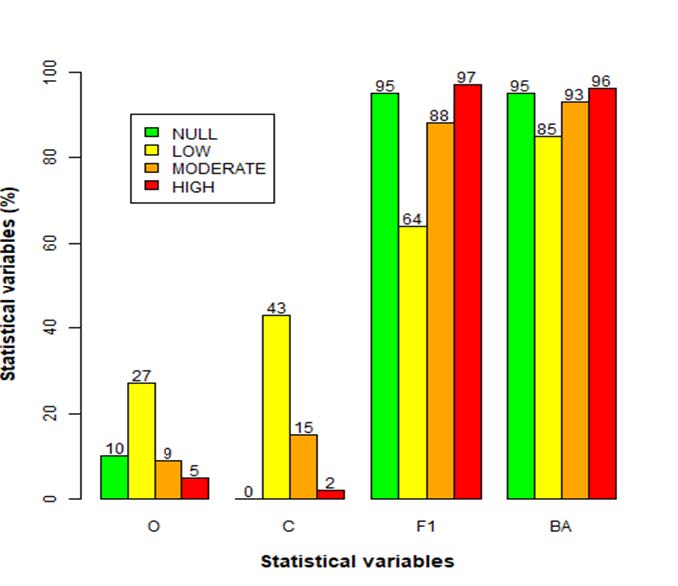

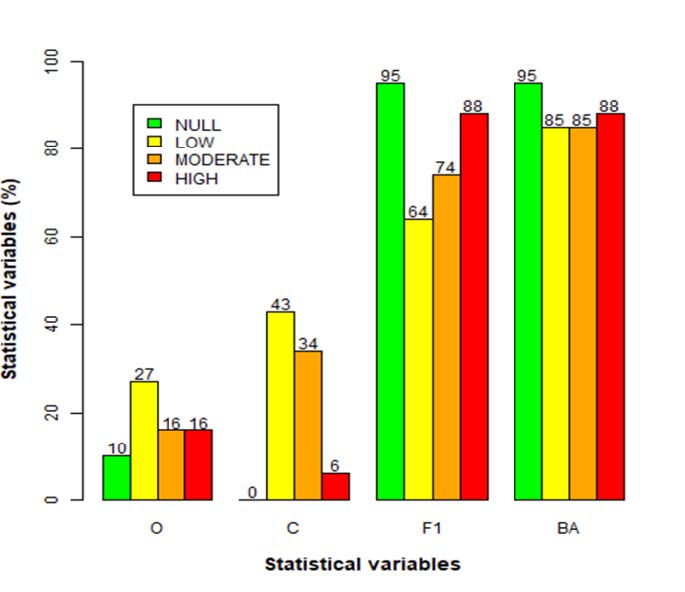

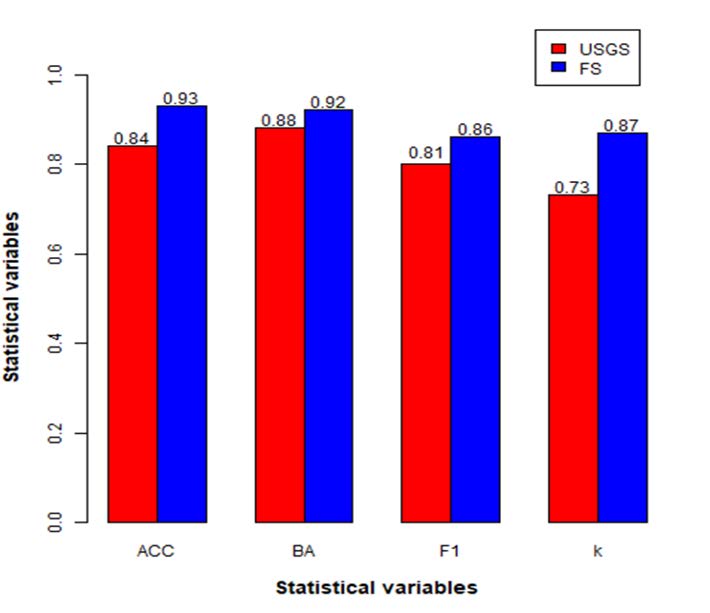
Figure 7: (Up) Fire severity assessment, using the methodology proposed in this study (FS, Table 8), based on omission errors (O), commission errors (C), F1-score (F1) and Balanced Accuracy (BA). Results expressed in percentages. (Middle) Fire severity assessment, using the United States Geological Survey (USGS) methodology (Table 8), based on omission errors (O), commission errors (C), F1-score (F1) and Balanced Accuracy (BA). Results expressed in percentages. (Down) Comparative of FS and USGS methodologies based on Accuracy (ACC), Balanced Accuracy (BA), F1-score (F1) and Kappa index (k). Results of k are expressed by the kappa values of Table 9.
Figures 8 and 9 show the final maps of burned area delimitation and fire severity, respectively, classified using thresholds obtained (Table 6 and 8) from the spectral indices with the most accurate results (NBR2 for burned area delimitation and FS for fire severity). The forest fire represented is Zamora forest fire (Table 2), the largest analyzed in this study.


Figure 8: Burned area delimitation map (obtained by NBR2) focused on Zamora forest fire (Castilla y León, June 2022). The reference coordinate system is WGS84 (EPSG: 4326).

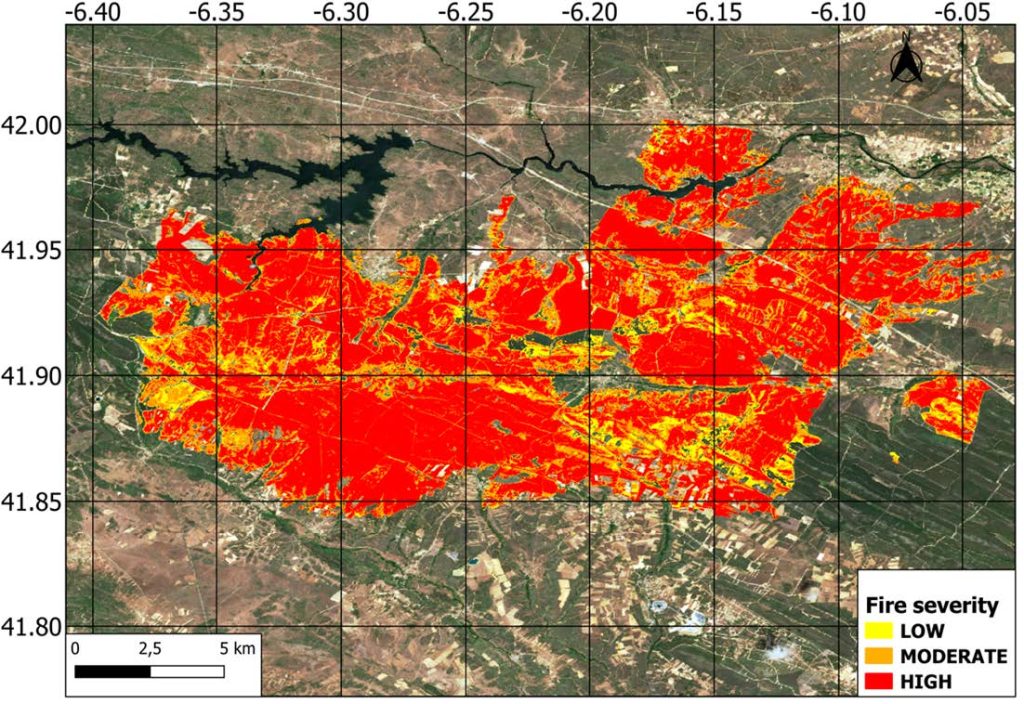
Figure 9: Fire severity map obtained by the combination of FS methodology, focused on Zamora forest fire (Castilla y León, June 2022). The reference coordinate system is WGS84 (EPSG: 4326).
5. Discussion
The large number of Sentinel-2 images available allows the study of large forest fires with a necessarily high spatial and temporal resolution. However, the use of optical satellites also entails a series of limitations, such as the presence of clouds. In this study, despite choosing cloud-free images within the area of influence of the fire, and applying a cloud mask to all the images, this is sometimes not enough, and omission errors corresponding to areas of clouds or shadows are sometimes found (Tarrio et al., 2020). In addition, there are several types of surfaces more commonly reported to generate spectral confusions with burned areas like water bodies, urban areas and shadows (Parnot, 1988; Chuvieco & Congalton, 1988). The use of radar techniques, such as Sentinel-1 satellite, is an alternative due to the practically null disturbance caused by clouds (Tanase et al., 2015). But, considering the high processing that must be carried out in comparison with optical systems, it was declined (Wicks et al., 2004; Burigana & Magnini, 2017).
The spectral indices, defined as band combination algorithms, allow to combine spectral bands whose spectral response behaves differently after the occurrence of a forest fire (Delegido et al., 2018). The bands most commonly used in this study were mainly combinations of NIR (decreased reflectivity caused by vegetation loss) and SWIR (increased reflectivity caused by moisture loss and increased observed ground surface area) (Escuin et al., 2008; Chuvieco, 2002).
The use of thresholding, as an image classification technique, was carried out instead of other methods such as supervised or unsupervised classifications, which are widely used in the field of forest fires (Shin et al., 2019; Bastarrika et al., 2014; Pulvirenti et al., 2020). Thresholding technique, based on statistics such as mean and standard deviation, is considered a fast and easy method (Hervás & Rosin, 2001). However, it has various inconveniencies such as selecting the suitable threshold to discriminate between classes (e.g. burnt and unburned) (Chuvieco & Martín, 1998).
In relation to burned area delimitation dNBR2 index, obtained as a combination of the two Sentinel SWIR bands (Eq. (2)), is chosen considering the coincidence area (97%), and the mean of omission and commission area (5%) parameters. RdNBR index, represents the same coincidence area but with the highest commission errors (13%). In terms of burned area delimitation, it is considered more appropriate to reduce the omission error as much as possible and, therefore, to detect the maximum number of pixels that really belong to burned areas. Moreover, there are different techniques to eliminate the commission errors obtained, such as the application of spatial filters or, if it is possible, the elimination of those groups of pixels that achieve a certain criterion (e.g. area less than one hectare) (Chuvieco, 2008). The results obtained using the dNBR2 index show errors of omission (3%) and commission (7%) lower than those obtained by Pepe and Parente in 2018 (12.2% and 15.5%, respectively) and by Filipponi in 2019 (40.7% and 24.28%, respectively) for forest fires in Italy and using the NBR, BAIS2 and NDVI indices from Sentinel-2 data. Boschetti et al., study in 2008 focused on 2008 Greece forest fires using MODIS product, also obtains higher omission and commission errors (10.75% and 17%, respectively) than those provided by dNBR2 index. Another study, carried out by Donezar-Hoyos et al. (2017) using the temporal difference of the Burn Area Index (BAI) (Chuvieco & Martín, 1998) from Sentinel-2 images, shows omission errors (0.5%) lower than those obtained in this study (4%). Nevertheless, it should be noted that the results obtained by Donezar-Hoyos et al. (2017) focus exclusively on a single fire, thus reducing the possibility of errors due to the smaller size of the study area.
Regarding fire severity results, the use of three different spectral indices (BAIS2, NBR and NBR3) for each vegetation density class (low, mix and full density, respectively) provides more accurate results than the results provided by the United States Geological Survey (USGS) methodology. Although the null and low fire severity degrees were classified equally in both methodologies, FS methodology obtained lower omission (O) and commission (C) errors for moderate and high severity (Figure 6). Despite the fact that FS performed accurate results than USGS, it is important to note that USGS is used globally (without dividing the area according to vegetation density). In comparison with other scientific studies, the value of kappa index obtained (0.93) is higher than the performed by Quintano et al. (2018) study (kappa equal to 0.80) and Arellano et al. (2017) study (kappa equal to 0.70), which use Landsat-8 images and the Composite Burn Index (CBI) as fire severity reference data. However, the kappa parameter also has limitations on accuracy measures due to randomness and quantity disagreement (Pontius & Millones, 2011). Gibson et al. (2020) study (more than 100,000 validation plots obtained by high-resolution photography photointerpretation) provides higher Balanced Accuracy (BA) metric in null severity (0.96) but lower for the other fire severity classes (0.80, 0.65 and 0.90 for low, moderate and high severity, respectively) than BA performed in this study (Figure 6a). The fire severity omission and commission errors results obtained are higher than Quintano et al. (2018) study in null and low severity (omission = 5% and 0%, commission = 0% and 23%, respectively) and lower in moderate and high severity (omission = 24% and 31%, commission = 23% and 13%, respectively). The fire severity commission errors results obtained are higher than Arellano et al. (2017) study in low and moderate severity (commission = 20% and 10,3%, respectively) and lower in high severity (commission = 23.3%, respectively). In this sense, it is important to note that this study assigns more weight to high severity, as it considers the strong relationship between high severity and erosion risks (forest structure completely damaged leads to high risk of erosion). Despite Quintano et al. (2018) and Arellano et al. 2017 works are focused in only one fire located in a specific climate (Mediterranean and Atlantic, respectively), the quantity and homogeneity of field plots used is higher than those used in this study (e.g. only 16 low severity plots are used in this study validation). Unfortunately, the quantity and homogeneity of field plots depends on the degree of access to the fire (number of fieldwork days, safe measurement areas, adverse weather, topography, …) and the predominant fire severity in the forest fire area, making it very difficult to obtain a large and homogeneous database (Morgan et al., 2014).
6. Conclusions
Based on Sentinel-2 images and field plots obtained in forest fires occurred in Spain (2018-2022), this study represents an innovation in the forest fires field, enabling the possibility of obtaining (separately) burned area and fire severity maps using Sentinel-2 satellite data. In both cases, statistical tests were performed using spectral indices commonly used in forest fires literature and all possible combinations of normalized differential spectral indices from Sentinel-2 bands. For burned area estimation the dNBR2 index is the suitable algorithm, while for fire severity estimation the use of three different spectral indices (BAIS2, NBR and NBR3) for each vegetation density class (low, mix and full density, respectively) is selected as the best option. The selection criteria used is based on statistics such as omission and commission errors, together with the Accuraccy (ACC), Balanced Acccuracy (BA), F1-score (F1) and Kappa statistic (k). It is demonstrated that the combinations between red, near infrared (NIR) and short-wave infrared (SWIR) bands are suitable for differentiating between healthy and burned vegetation, and between the different fire severity classes.
Despite the satisfactory results obtained in this study, several statements should be considered. Firstly, all the tests carried out are based on forest fires occurred in Spain, being most of them in Galicia. Therefore, the reliability of this methodology does not correspond to other study areas. Secondly, field campaigns were carried out with certain limitations mainly due to the terrain topography and the weather. In addition, as the field plots were selected visually using the Ruiz-Gallardo et al., 2004 protocol, only those plots that clearly represented one of the four severity classes (null, low, moderate or high severity) were considered valid.
Finally, to improve the line of research followed in this study, future works can make a significant contribution in the light of the above. A database extension, both number of fires and their location (fires occurring outside Spain) and the fire severity field plots (higher number of field plots and homogeneity) should contribute to improving the scope of this study.
Autor Contributions
José A. Sobrino: Funding acquisition, Project administration, Resources, Supervision, Investigation, Conceptualization, Methodology, Writing – Review & Editing. Rafael Llorens: Methodology, Software, Validation, Formal analysis, Investigation, Data Curation, Writing – Original Draft. Cristina Fernández, José M. Fernández-Alonso and José Antonio Vega: Conceptualization, Methodology, Writing – Review & Editing.
Declaration of Competing Interest
The authors declare that they have no known competing financial interests or personal relationships that could have appeared to influence the work reported in this paper.
Data availability
Data will be made available on request.
Acknowledgments
The authors thank the associate editor and the reviewers for their systematic review and valuable comments.
Funding
This work was funded by the research project EPyRIS, which is part of the Interreg SUDOE program of the European Union, project number SOE2/P5/E0811.
References
Arellano, S., Vega, J. A., Rodríguez y Silva, F., Fernández, C., Vega-Nieva, D., Álvarez-González, J. G., & Ruiz-González, A. D. (2017). Validación de los índices de teledetección dNBR y RdNBR para determinar la severidad del fuego en el incendio forestal de Oia-O Rosal (Pontevedra) en 2013. Revista de Teledetección, (49), 49-61.
Balsak, A., & San, B. T. (2023). Evaluation of the effect of spatial and temporal resolutions for digital change detection: case of forest fire. Natural Hazards, 1-20.
Bar, S., Parida, B. R., & Pandey, A. C. (2020). Landsat-8 and Sentinel-2 based Forest fire burn area mapping using machine learning algorithms on GEE cloud platform over Uttarakhand, Western Himalaya. Remote Sensing Applications: Society and Environment, 18, 100324.
Bastarrika, A., Alvarado, M., Artano, K., Martinez, M. P., Mesanza, A., Torre, L. & Chuvieco, E. (2014). BAMS: A tool for supervised burned area mapping using Landsat data. Remote Sensing, 6(12), 12360-12380.
Boca, T., & Rodríguez, G. (2012). Métodos estadísticos de la evaluación de la exactitud de productos derivados de sensores remotos. Instituto de Clima y Agua, INTA Castelar.
Boschetti, L., Roy, D., Barbosa, P., Boca, R., & Justice, C. (2008). A MODIS assessment of the summer 2007 extent burned in Greece. International Journal of Remote Sensing, 29(8), 2433-2436.
Burigana, L., & Magnini, L. (2017). Image processing and analysis of radar and lidar data: new discoveries in Verona southern lowland (Italy). STAR: Science & Technology of Archaeological Research, 3(2), 490-509.
Chu, T., & Guo, X. (2014). Remote sensing techniques in monitoring post-fire effects and patterns of forest recovery in boreal forest regions: A review. Remote Sensing, 6(1), 470-520.
Chuvieco Salinero, E. (2008). Teledetección ambiental: La observación de la tierra desde el espacio (No. 528.8 CHU).
Chuvieco Salinero, E. (2002). Teledetección ambiental: la observación de la Tierra desde el espacio. Ariel,.
Chuvieco, E., & Congalton, R. G. (1988). Mapping and inventory of forest fires from digital processing of TM data. Geocarto International, 3(4), 41-53.
Chuvieco, E., & Martín, M. P. (1998). Cartografía de grandes incendios forestales en la Península Ibérica a partir de imágenes NOAA-AVHRR.
Chuvieco, E., Riaño, D., Danson, F. M., & Martin, P. (2006). Use of a radiative transfer model to simulate the postfire spectral response to burn severity. Journal of Geophysical Research: Biogeosciences, 111(G4).
Chuvieco, E., Riaño, D., Van Wagtendok, J., & Morsdof, F. (2003). Fuel loads and fuel type mapping. In Wildland fire danger estimation and mapping: The role of remote sensing data (pp. 119-142).
Congalton, R. G. (1991). A review of assessing the accuracy of classifications of remotely sensed data. Remote sensing of environment, 37(1), 35-46.
Congalton, R. G., & Green, K. (2019). Assessing the accuracy of remotely sensed data: principles and practices. CRC press.
Costafreda-Aumedes, S., Vega-Garcia, C., & Comas, C. (2018). Improving fire season definition by optimized temporal modelling of daily human-caused ignitions. Journal of environmental management, 217, 90-99.
Curran, P.J., Dungan, J.L., Gholz, G.H., 1990. Exploring the relationship between reflectance red edge and chlorophyll content in slash pine. Tree Physiol. 7, 33–48.
Delegido, J., Pezzola, A., Casella, A., Winschel, C., Urrego, E. P., Jimenez, J. C., … & Moreno, J. (2018). Estimación del grado de severidad de incendios en el sur de la provincia de Buenos Aires, Argentina, usando Sentinel-2 y su comparación con Landsat-8. Revista de Teledetección, (51), 47-60.
Donezar-Hoyos, U., Larrañaga Urien, A., Tamés-Noriega, A., Sánchez-Gil, C., Albizua-Huarte, L., Ciriza-Labiano, R., & del Barrio-Arellano, F. (2017). Aplicación de imágenes Sentinel-1 y Sentinel-2 en la detección y delineación de información de crisis de desastres naturales en el marco de los servicios Copernicus EMS. Revista de Teledetección, (50), 49-57.
Escuin, S., Navarro, R., & Fernández, P. (2008). Fire severity assessment by using NBR (Normalized Burn Ratio) and NDVI (Normalized Difference Vegetation Index) derived from LANDSAT TM/ETM images. International Journal of Remote Sensing, 29(4), 1053-1073.
Fernández-Manso, A., Fernández-Manso, O., & Quintano, C. (2016). SENTINEL-2A red-edge spectral indices suitability for discriminating burn severity. International journal of applied earth observation and geoinformation, 50, 170-175.
Filipponi, F. (2018). BAIS2: Burned area index for Sentinel-2. In Multidisciplinary Digital Publishing Institute Proceedings (Vol. 2, No. 7, p. 364).
Filipponi, F. (2019). Exploitation of sentinel-2 time series to map burned areas at the national level: A case study on the 2017 italy wildfires. Remote Sensing, 11(6), 622.
Fletcher, K., 2012. Sentinel-2: ESA’s Optical High-Resolution Mission for GMES Operational Services (European Spatial Agency SP-1322/2) ISBN 978-92-9221-419-7, ISSN 0379-6566.
Fornacca, D., Ren, G., & Xiao, W. (2018). Evaluating the best spectral indices for the detection of burn scars at several post-fire dates in a mountainous region of Northwest Yunnan, China. Remote Sensing, 10(8), 1196.
García-Llamas, P., Suárez-Seoane, S., Taboada, A., Fernández-Manso, A., Quintano, C., Fernández-García, V., … & Calvo, L. (2019). Environmental drivers of fire severity in extreme fire events that affect Mediterranean pine forest ecosystems. Forest Ecology and Management, 433, 24-32.
Hervás, J., & Rosin, P. L. (2001, November). Tratamiento digital de imágenes de teledetección en el espectro óptico para el reconocimiento y control de deslizamientos. In Proc. V Simposio Nacional sobre Taludes y Laderas Inestables (pp. 63-74).
Jiménez-Muñoz, J. C., Sobrino, J. A., Plaza, A., Guanter, L., Moreno, J., & Martínez, P. (2009). Comparison between fractional vegetation cover retrievals from vegetation indices and spectral mixture analysis: Case study of PROBA/CHRIS data over an agricultural area. Sensors, 9(02), 768-793.
Justice, C. O., Malingreau, J. P., & Setzer, A. W. (1993). Satellite remote sensing of fires- Potential and limitations. Fire in the environment- The ecological, atmospheric, and climatic importance of vegetation fires. Chichester, United Kingdom, John Wiley & Sons, Ltd., 1993, 77-88.
Kaufman, Y. J., & Remer, L. A. (1994). Detection of forests using mid-IR reflectance: an application for aerosol studies. IEEE transactions on geoscience and remote sensing, 32(3), 672-683.
Keeley, J. E. (2009). Fire intensity, fire severity and burn severity: a brief review and suggested usage. International journal of wildland fire, 18(1), 116-126.
Key, C. H., & Benson, N. C. (2006). Landscape assessment (LA). In: Lutes, Duncan C.; Keane, Robert E.; Caratti, John F.; Key, Carl H.; Benson, Nathan C.; Sutherland, Steve; Gangi, Larry J. 2006. FIREMON: Fire effects monitoring and inventory system. Gen. Tech. Rep. RMRS-GTR-164-CD. Fort Collins, CO: US Department of Agriculture, Forest Service, Rocky Mountain Research Station. p. LA-1-55, 164.
Korets, M.A., Ryzhkova, V.A., Danilova, I.V., Sukhinin, A.I., Bartalev, S.A., 2010. Forest disturbance assessment using satellite data for moderate and low resolution. In: Balzter, H. (Ed.), Environment Change in Siberia: Earth Observation, Field Studies and Modeling. Springer.
Landis, J. R., & Koch, G. G. (1977). The measurement of observer agreement for categorical data. biometrics, 159-174.
Lasaponara, R. (2006). Estimating spectral separability of satellite derived parameters for burned areas mapping in the Calabria region by using SPOT-Vegetation data. Ecological Modelling, 196(1-2), 265-270.
Lutes, D. C., Keane, R. E., Caratti, J. F., Key, C. H., Benson, N. C., Sutherland, S., & Gangi, L. J. (2006). FIREMON: Fire effects monitoring and inventory system. Gen. Tech. Rep. RMRS-GTR-164. Fort Collins, CO: US Department of Agriculture, Forest Service, Rocky Mountain Research Station. 1 CD., 164.
Malinowski, R., Lewiński, S., Rybicki, M., Gromny, E., Jenerowicz, M., Krupiński, M., … & Schauer, P. (2020). Automated production of a land cover/use map of Europe based on Sentinel-2 imagery. Remote Sensing, 12(21), 3523.
Martín, M. P. (1998). Cartografía e inventario de incendios forestales en la Península Ibérica a partir de imágenes NOAA-AVHRR. Departmento de Geografía. Alcalá de Henares, Universidad de Alcalá.
Max Kuhn (2021). caret: Classification and Regression Training. R package version 6.0-90. https://CRAN.R-project.org/package=caret
McHugh, M. L. (2012). Interrater reliability: the kappa statistic. Biochemia medica, 22(3), 276-282.
Miller, J. D., & Thode, A. E. (2007). Quantifying burn severity in a heterogeneous landscape with a relative version of the delta Normalized Burn Ratio (dNBR). Remote Sensing of Environment, 109(1), 66-80.
Morgan, P., Keane, R. E., Dillon, G. K., Jain, T. B., Hudak, A. T., Karau, E. C. & Strand, E. K. (2014). Challenges of assessing fire and burn severity using field measures, remote sensing and modelling. International Journal of Wildland Fire, 23(8), 1045-1060.
Mpakairi, K. S., Ndaimani, H., & Kavhu, B. (2020). Exploring the utility of Sentinel-2 MSI derived spectral indices in mapping burned areas in different land-cover types. Scientific African, 10, e00565.
Navarro, G., Caballero, I., Silva, G., Parra, P. C., Vázquez, Á., & Caldeira, R. (2017). Evaluation of forest fire on Madeira Island using Sentinel-2A MSI imagery. International Journal of Applied Earth Observation and Geoinformation, 58, 97-106.
Parker, B. M., Lewis, T., & Srivastava, S. K. (2015). Estimation and evaluation of multi-decadal fire severity patterns using Landsat sensors. Remote Sensing of Environment, 170, 340-349.
Parks, S. A., Dillon, G. K., & Miller, C. (2014). A new metric for quantifying burn severity: the relativized burn ratio. Remote Sensing, 6(3), 1827-1844.
Parnot, J. (1988, October). Inventaire des feux de brouse au Burkina Faso saison seche 1986-1987. In 22nd International Symposium on Remote Sensing of the Environment (Vol. 20, pp. 54-63).
Pausas, J. G., & Keeley, J. E. (2019). Wildfires as an ecosystem service. Frontiers in Ecology and the Environment, 17(5), 289-295.
Pepe, M., & Parente, C. (2018). Burned area recognition by change detection analysis using images derived from Sentinel-2 satellite: The case study of Sorrento Peninsula, Italy. Journal of Applied Engineering Science, 16(2), 225-232.
Pereira, J. M. C., Chuvieco, E., Beaudoin, A., & Desbois, N. (1997). Remote sensing of burned areas: a review. A review of remote sensing methods for the study of large wildland fires, 127-184.
Picos, J., Alonso, L., Bastos, G., & Armesto, J. (2019). Event-based integrated assessment of environmental variables and wildfire severity through Sentinel-2 Data. Forests, 10(11), 1021.
Picotte, J. J., & Robertson, K. (2011). Timing constraints on remote sensing of wildland fire burned area in the southeastern US. Remote Sensing, 3(8), 1680-1690.
Pontius Jr, R. G., & Millones, M. (2011). Death to Kappa: birth of quantity disagreement and allocation disagreement for accuracy assessment. International Journal of Remote Sensing, 32(15), 4407-4429.
Pulvirenti, L., Squicciarino, G., Fiori, E., Fiorucci, P., Ferraris, L., Negro, D. & Puca, S. (2020). An automatic processing chain for near real-time mapping of burned forest areas using sentinel-2 data. Remote Sensing, 12(4), 674.
Quintano, C., Fernández-Manso, A., & Fernández-Manso, O. (2018). Combination of Landsat and Sentinel-2 MSI data for initial assessing of burn severity. International journal of applied earth observation and geoinformation, 64, 221-225.
R Core Team (2021). R: A language and environment for statistical computing. R Foundation for Statistical Computing, Vienna, Austria. URL https://www.R-project.org/.
Richter, R., & Schläpfer, D. (2005). Atmospheric/topographic correction for satellite imagery. DLR report DLR-IB, 565.
Ruiz-Gallardo, J. R., Castaño, S., & Calera, A. (2004). Application of remote sensing and GIS to locate priority intervention areas after wildland fires in Mediterranean systems: a case study from south-eastern Spain. International Journal of Wildland Fire, 13(3), 241-252.
Ryan, K. C., & Noste, N. V. (1985). Evaluating prescribed fires. Lotan, James E.; Kilgore, Bruce M.; Fischer, William C, 15-18.
Salvoldi, M., Siaki, G., Sprintsin, M., & Karnieli, A. (2020). Burned area mapping using multi-temporal sentinel-2 data by applying the relative differenced aerosol-free vegetation index (RdAFRI). Remote Sensing, 12(17), 2753.
Simard, S. J. (1991). Fire severity, changing scales, and how things hang together. International Journal of Wildland Fire, 1(1), 23-34.
Shin, J. I., Seo, W. W., Kim, T., Park, J., & Woo, C. S. (2019). Using UAV multispectral images for classification of forest burn severity—A case study of the 2019 Gangneung forest fire. Forests, 10(11), 1025.
Sobrino, J. A., Jiménez-Muñoz, J. C., Sòria, G., Romaguera, M., Guanter, L., Moreno, J., … & Martínez, P. (2008). Land surface emissivity retrieval from different VNIR and TIR sensors. IEEE transactions on geoscience and remote sensing, 46(2), 316-327.
Sobrino, J. A., Llorens, R., Fernández, C., Fernández-Alonso, J. M., & Vega, J. A. (2019). Relationship between soil burn severity in forest fires measured in situ and through spectral indices of remote detection. Forests, 10(5), 457.
Sobrino, J. A., García-Monteiro, S.,Julien, Y., (2024). An analysis of the Lake Surface Temperature evolution of the world’s largest lakes during the years 2003-2020 using MODIS data. Recent Advances in Remote Sensing. doi 10.62880/rars240001
Soverel, N. O., Perrakis, D. D., & Coops, N. C. (2010). Estimating burn severity from Landsat dNBR and RdNBR indices across western Canada. Remote Sensing of Environment, 114(9), 1896-1909.
Sunar, F., & Özkan, C. (2001). Forest fire analysis with remote sensing data. International Journal of Remote Sensing, 22(12), 2265-2277.
Tanase, M. A., Kennedy, R., & Aponte, C. (2015). Radar Burn Ratio for fire severity estimation at canopy level: An example for temperate forests. Remote Sensing of Environment, 170, 14-31.
Tarrio, K., Tang, X., Masek, J. G., Claverie, M., Ju, J., Qiu, S. & Woodcock, C. E. (2020). Comparison of cloud detection algorithms for Sentinel-2 imagery. Science of Remote Sensing, 2, 100010.
Teodoro, A., & Amaral, A. (2019). A statistical and spatial analysis of Portuguese forest fires in summer 2016 considering Landsat 8 and Sentinel 2A data. Environments, 6(3), 36.
Tharwat, A. (2020). Classification assessment methods. Applied Computing and Informatics.
Tran, B. N., Tanase, M. A., Bennett, L. T., & Aponte, C. (2018). Evaluation of spectral indices for assessing fire severity in Australian temperate forests. Remote Sensing, 10(11), 1680.
Trigg, S., & Flasse, S. (2001). An evaluation of different bi-spectral spaces for discriminating burned shrub-savannah. International Journal of Remote Sensing, 22(13), 2641-2647.
Vanderhoof, M. K., Hawbaker, T. J., Teske, C., Ku, A., Noble, J., & Picotte, J. (2021). Mapping wetland burned area from Sentinel-2 across the Southeastern United States and its contributions relative to Landsat-8 (2016–2019). Fire, 4(3), 52.
Veraverbeke, S., Lhermitte, S., Verstraeten, W. W., & Goossens, R. (2011). Evaluation of pre/post-fire differenced spectral indices for assessing burn severity in a Mediterranean environment with Landsat Thematic Mapper. International Journal of Remote Sensing, 32(12), 3521-3537.
White, J. D., Ryan, K. C., Key, C. C., & Running, S. W. (1996). Remote sensing of forest fire severity and vegetation recovery. International Journal of Wildland Fire, 6(3), 125-136.
Wicks, M. C., & Himed, B. (2004). Four problems in radar. In Computational noncommutative algebra and applications (pp. 57-73). Springer, Dordrecht.
Zald, H. S., & Dunn, C. J. (2018). Severe fire weather and intensive forest management increase fire severity in a multi‐ownership landscape. Ecological Applications, 28(4), 1068-1080.
Publisher’s Note
The statements, opinions and data contained in all publications are solely those of the individual author(s) and contributor(s) and not of Recent Advances S.L. and/or the editor(s). Recent Advances S.L. and/or the editor(s) disclaim responsability for any injury to people or property resulting from any ideas, methods, instructions or products referred to in the content.