



Performance evaluation of Landsat TIRS/2 and ECOSTRESS Land Surface Temperature Products over Mountainous Snow-Covered Areas
Sara Arioli

1*, Ghislain Picard
2, Simon Gascoin
3, Laurent Arnaud
2- Université de Strasbourg, SERTIT-ICube, Illkirch, France
- Université Grenoble-Alpes, CNRS, IGE, 38000 Grenoble, France
- Université de Toulouse, CNRS, CNES, IRD, INRAE, Centre d’Études Spatiales de la Biosphère, Toulouse, France
* Author to whom correspondence should be addressed.

Abstract
The limited evaluation of remote sensing Thermal InfraRed (TIR) products over snow-covered surfaces compromises their exploitation in cryospheric sciences. This study assesses for the first time the accuracy of high-resolution Land Surface Temperature (LST) products from Landsat 8, Landsat 9, and ECOSTRESS in a snow-covered Alpine site, using 2 m resolution maps of the snow surface temperature acquired in-situ over two winter seasons. The results show a general warm bias across all LST products compared to in-situ measurements, with varying magnitudes. Landsat Collection 2 LST products, with a Mean Absolute Error (MAE) of +1.06 K, are within the expected 2% accuracy, in agreement with previous studies on warmer surfaces. The MAE is slightly warmer for ECOSTRESS Version 1 LST, with +1.24 K, exceeding its declared accuracy goals (0.3 K precision, 1.0 K accuracy), potentially due to calibration issues previously found for temperatures below 295 K. This performance remains satisfactory considering that ECOSTRESS is designed to operate over warm surfaces. Still, a possible source of error was identified in the low emissivity values used for the LST retrieval, likely due to limitations in the representation of snow emissivity in the ECOSTRESS spectral library. The NDSI-based emissivity estimation approach used by Landsat yields better results than ECOSTRESS, and could be implemented by future TIR missions such as TRISHNA and LSTM, that will also have bands in the optical domain. More problematic, ECOSTRESS Version 2 LST shows a significantly higher bias of +3.91 K, indicating a performance degradation. The likely cause of this issue is the correction of a cold bias observed in ECOSTRESS Version 1 LST for temperatures above 270 K. As these changes compromise the performance of ECOSTRESS LST over snow-covered areas, its correction in upcoming ECOSTRESS LST collections would contribute to extend the possible exploitation of ECOSTRESS LST over snow and other cold surfaces of several years.Keywords
Thermal Infrared (TIR), Snow, Land Surface Temperature (LST), Validation1. Introduction
The snow surface temperature is a key variable to solve the energy balance equation of the snowpack, calculate snow melt, and infer snow density (Robledano et al. 2022, Colombo et al. 2019). Hence, assimilation of remotely-sensed snow surface temperature in a snowpack model can significantly improve snow water equivalent estimates (Alonso et al. 2023). However, the use of Thermal Infrared (TIR) remote sensing in cryospheric research remains limited (Colombo et al. 2023, Alonso et al. 2023). This may be partly due to the limited number of evaluation studies of TIR products on snow-covered surfaces. The most straightforward validation method for Land Surface Temperature products (LST) is the temperature-based (T-based) method, which consists in comparing satellite-derived LST with ground-based snow surface temperature measurements (hereinafter SnowST, Li et al. 2023). For example, Westermann et al. (2012) compared NASA’s Moderate-Resolution Imaging Spectroradiometer (MODIS) LST over snow with SnowST derived from pyrgeometer measurements at a site on Svalbard, Norway. They found excellent agreement for SnowST below -15°C and an increasing negative bias up to -10 K for SnowST of 0°C, potentially due to pixel contamination by clouds. Hall et al. (2008) approached the T-based evaluation of MODIS LST over a flat area of Greenland in three different ways. First, they used large areas covered by melting snow as target of well-known temperature. Second, they used ground measurements of air temperature as SnowST. Third, similarly to Hall et al. (2018), they used TIR radiometers. They found an average bias of -0.3 ± 2.1 K of MODIS against the different SnowSTs. Still, authors of both studies warn about the limited spatial representativeness of the different SnowST measurement methods on non-homogeneous terrain. For example, TIR radiometers have a small footprint (in the order of 1-10 m2 according to installation height) and are unable to capture the spatial variability of the surface temperature induced by rugged terrain. The correlation between air and snow surface temperature is also limited by complex atmospheric dynamics in mountain areas (Lundquist and Cayan 2007). Arioli et al. (2024c) adopted a novel approach to obtain ground-based snow surface temperature measurements by uncooled TIR cameras. Although the use of these instruments for thermography is not new (Langer et al. 2010), they addressed several shortcomings of the instrument and managed to reduce the high uncertainty of the measurements that limited its deployment in cryospheric research (Kraaijenbrink et al. 2018, Wigmore and Molotch 2023). They produced a dataset including over 130,000 spatially resolved measurements of surface temperature of a snow-covered Alpine site (Col du Lautaret, French Alps) at 2 m resolution during the 2022 and 2023 winter-spring seasons (Arioli et al. 2024a, 2024b). Here, we take advantage of this dataset to assess the accuracy of three LST products acquired by high-resolution TIR sensors. More specifically, we assess Landsat 8/9 (L8/L9) TIRS/2 LST products (Collection 2, C2), and ECOsystem Spaceborne Thermal Radiometer Experiment on Space Station (ECOSTRESS) LST products (Version 1, V001, and Version 2, V002). With a resolution of 30 m (up-sampled from 100 m) and 70 m respectively, these sensors are more relevant than MODIS for the study of snow surface temperatures in mountain regions, where the spatial variability is high (Lundquist and Cayan 2007). With this evaluation, our objective is to contribute to reliable use of high-resolution LST products in cryospheric sciences, which is especially important considering the upcoming launch of a new generation of TIR sensors that will be onboard the TRISHNA and LSTM satellites (Roujean et al. 2021, Koetz et al. 2018).
2. Materials and Methods
2.1. Surface temperature images from in-situ measurements
The ground-based snow surfaces temperature measurements used for validation are issued from datasets in Arioli et al. (2024a) and Arioli et al. (2024b) and described in detail in Arioli et al. (2024c). They provide maps of the snow surface temperature acquired with an uncooled TIR camera acquired at the Col du Lautaret (French Alps) during winter 2021-2022 and spring 2023. Although the same TIR camera was used for both acquisition campaigns, a thermoelectric module was added to the camera casing for the 2023 campaign, with the goal of increasing the internal temperature stability and reducing measurement noise with respect to the previous campaign. All images were thoroughly processed radiometrically and geometrically to remove instrumental bias and reduce image distortions. Finally, they were projected onto a digital elevation model to produce surface temperature maps at 2 m resolution (EPSG:32632 projection). Their validation was performed against high-accuracy, nadir-oriented TIR radiometers (Campbell Scientific IR120 and Heitronics CT15.85) deployed in two different points of the camera’s field of view (FOV). Due to the improvements in the acquisition setup between both campaigns, the validation yields different results for winter 2021-2022 and for spring 2023. The Mean Absolute Error (MAE) is 1.28 K for winter 2021-2022 and 0.68 K for spring 2023. The median error, equal to -1.05 K for 2021-2022 and +0.22 K for 2023, was subtracted from the images before comparison with LST products. This subsequently reduced the MAE to 0.86 K for 2021-2022 and to 0.63 K for 2023.
2.2. Landsat 8/9 C2, ECOSTRESS V001 and V002 Land Surface Temperature
Twenty cloud-free day-time L8 and L9 LST images from C2 covering our site were selected and downloaded from NASA’s USGS Earth Explorer (https://earthexplorer.usgs.gov/). The products are distributed as orthorectified tiff-format images with a grid resolution of 30 m. LST are retrieved from satellite measurements from two distinct paths, 195 and 196 and are projected into the EPSG:32632 or EPSG:32631 accordingly. For each of ECOSTRESS V001 and V002, eleven cloud-free LST products were selected and downloaded from AppEEARS (https://appeears.earthdatacloud.nasa.gov) in Swath format (that retains the data in the original satellite acquisition geometry) and EPSG:4326 projection. Given the peculiar shape of the International Space Station’s orbit, each LST product has a different geometry. Finally, the V002 differs from the V001 by the reduction of a checkerboard artifact, improvement of geolocation, radiance calibration, and cloud masking (Halverson et al. 2012). For both Landsat and ECOSTRESS, the LST product bundle also contains the emissivity of the TIR bands used for the retrieval.
3. Method
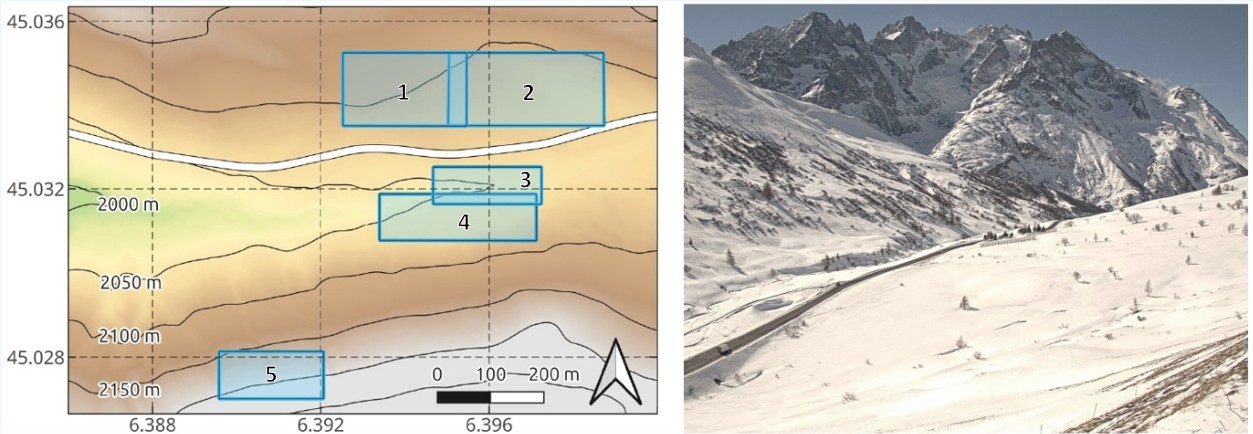
We defined five Areas of Interest (AOIs) within the camera’s FOV to compare satellite and in-situ measurements (Fig. 1). These include two AOIs on the south-facing slope and three on the north-facing slope, carefully selected to minimize the presence of non-snow objects and to reflect different snow characteristics. AOI 1 and 2, on the south facing slope, are exposed to solar radiation daily (cloud-permitting) throughout the whole winter, while AOI 3 and 4, on the north facing slope, receive no direct sunlight for over one month per winter. AOIs 1 and 3 are also more prone to accumulation of wind-blown snow than AOI 2 and 4. AOI 5 is higher in elevation (average 2187 m a.s.l.) than the other AOIs (average 2053 m to 2101 m a.s.l.) and receive no direct sunlight for over two months during winter. For each LST product, the closest-in-time SnowST map was used (with a time difference of less than one minute). In order to perform the comparison between ground-based SnowST and satellite LST, SnowST maps were clipped to the footprint whole satellite pixels within the AOIs, and averaged. The standard deviation of the camera-derived SnowST was calculated within each AOI. We excluded measurements when the standard deviation within an AOI was greater than 2 K to ensure homogeneity. This filtering reduced the number of usable observations from 100 to 73 for Landsat (20 LST per 5 AOIs, 27 excluded), and from 55 to 40 for ECOSTRESS V001 and V002 (11 LST per 5 AOIs, 15 excluded). To account for differences in acquisition geometry, we defined revised AOIs selecting only pixels that were fully comprised within the original AOI polygon. Revised AOIs cover 36% to 92% of the original AOIs and maintain at least 50% overlap between each other. For each LST product and its corresponding SnowST, the mean, minimum, maximum, and standard deviation of temperature in the revised AOI were computed. The same statistics were also calculated for the corresponding emissivity values from the LST product.
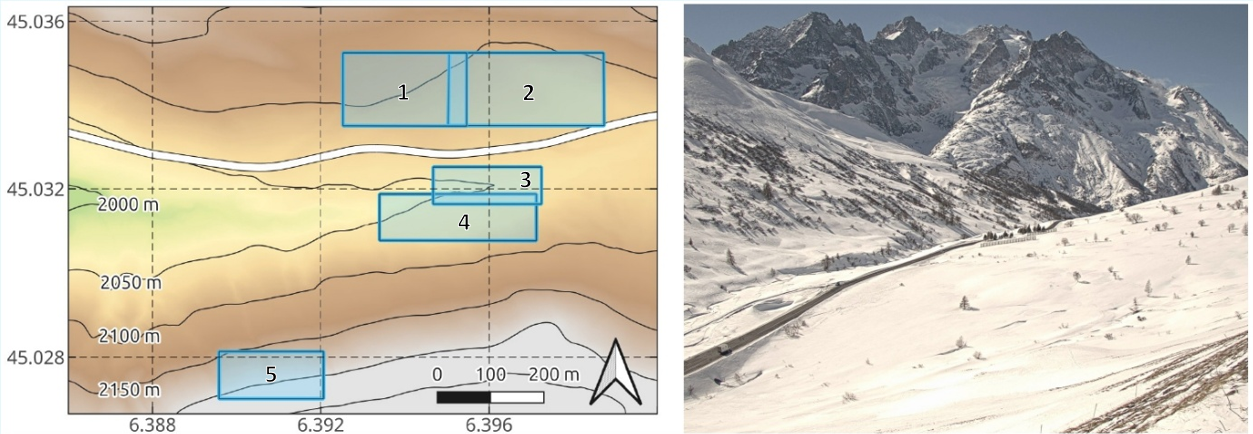
Figure 1: Elevation map of the west side of the Col du Lautaret (45.0347° N, 6.4051° E, 2057 m a.s.l, France) and the five areas selected for the comparison between satellite LST products and ground based measurements (left), picture of the area with the North facing slope on the left, the South facing slope on the right (right).
4. Results
4.1. Performance evaluation of Landsat-8/9 and ECOSTRESS surface temperatures
The comparison between LST and SnowST is presented in Table 1 and in Fig. 2a,b,c. All LST products present a positive mean bias with respect to the SnowST. Landsat 8/9 C2 LST exhibits the lowest bias and standard deviation, +1.06 ± 1.28 K. ECOSTRESS V001 follows with slightly higher values, +1.24 ± 1.52 K. Finally, ECOSTRESS V002 presents a much higher mean bias, +3.91 K, and a similar standard deviation of 1.32 K. Indeed, all mean surface temperatures extracted from V002 LST are higher than in-situ measurements. Fig. 2b,c show that, in some occasions, while the SnowST is close to 0°C, ECOSTRESS LST is well above the melting point. Still, the error statistics do not change significantly if temperature >-1°C are excluded, the mean bias becomes +1.14 ± 1.35 K for V001 and +3.97 ± 1.11 K for V002. The correlation between LST and SnowST is high for all products (0.97 to 0.98). Fig. 2d shows the comparison between the ECOSTRESS LST retrieved from the same acquisitions but processed in different collections, V001 and V002. The latter provides systematically higher temperatures than V001, with differences between +1.08 K and +4.35 K and a mean difference of +2.68 ± 0.74 K. However, the correlation between the two collections is above 0.99, showing that the issue is mainly a bias. The spatial and temporal variations of the bias with respect to the AOI position, season and acquisition time were also considered. The results of the comparison for AOI 1 to 4 reveal mean bias between +0.70 K and +1.95 K for Landsat and between +1.16 K and +1.90 K for ECOSTRESS V001. The RMSE are between 1.34 K and 1.63 K and between 0.91 K and 2.35 K for Landsat (14-16 samples per AOI) and ECOSTRESS V001 (7-9 samples per AOI) respectively. Considering the large RMSE and the small sample size, these differences are not considered statistically relevant. For a reason that remains unknown, AOI 5 has the smallest mean bias for both Landsat and ECOSTRESS V001, with respective values of +0.25 ± 1.01 K and -0.29 ± 1.37 K. Differences in bias between winter season – December, January and February, when surface melt is rare – and spring season – March and April, when surface melt occurs during most days – were also considered. For Landsat, the winter bias is +1.35 ± 1.34 K (46 samples) and the spring bias is +0.57 ± 1.75 K (27 samples). A weak, negative correlation – -0.37 – between the bias and SnowST was also found on the entire Landsat LST dataset. Still, the spread of the bias distribution is large, and the hypothesis of a degradation of the LST with decreasing temperature should be supported by further measurements. For ECOSTRESS V001, the winter bias is +1.44 ± 1.14 K (15 samples) and the spring bias is slightly lower but with a higher RMSE, +1.12 ± 1.93 K (25 samples). Thus, the performance of ECOSTRESS LST can be considered consistent throughout the snow season. Day/night differences were also considered exploiting 4 night-time images (acquired between 19:00 and 7:00 local time, UTC+1) included in the ECOSTRESS V001 dataset. The mean night-time bias is +0.52 ± 1.49 K, against a daytime bias of +1.66 ± 1.57 K. The lower night-time difference may be due to the homogeneity of the surface temperature during the night, that limits the effect of pixel bleeding. Yet, the lower value may merely reflect a random variation resulting from the small sample size.
Table 1: Summary of the results of the comparison between LST products and in-situ temperatures. The comparison is given for 73 areas of Landsat LST and 40 areas of ECOSTRESS V001 and V002 LST. The bias, RMSE, range of values are expressed in K.
| Source | Bias | RMSE | Range of values | Correlation coefficient |
| Landsat C2 | +1.06 | 1.28 | 6.22 | 0.97 |
| ECOSTRESS V001 | +1.24 | 1.52 | 8.68 | 0.98 |
| ECOSTRESS V002 | +3.91 | 1.32 | 5.82 | 0.98 |
4.2. Comparison of emissivities used for Landsat-8/9 and ECOSTRESS surface temperature retrieval
Fig. 2e shows the distribution of the band 10 (B10) and band 4 (B4) emissivities used to retrieve LST from Landsat and ECOSTRESS acquisitions respectively. B10, at 10.9 µm, is the only band used for Landsat retrieval. B4, at 10.5 µm, is the spectrally closest band used for the ECOSTRESS retrieval. Landsat emissivities fall within a narrow range between 0.9904 and 0.9915. All B4 emissivities used for ECOSTRESS V001 and V002 LST retrieval are lower and span a broader range of values, between 0.9613 and 0.9820 for V001 and between 0.9460 and 0.9820. Unlike surface temperatures, ECOSTRESS B4 emissivity values are nearly identical for V001 and V002, with a mean and maximum absolute difference of 0.004 and 0.017 respectively.
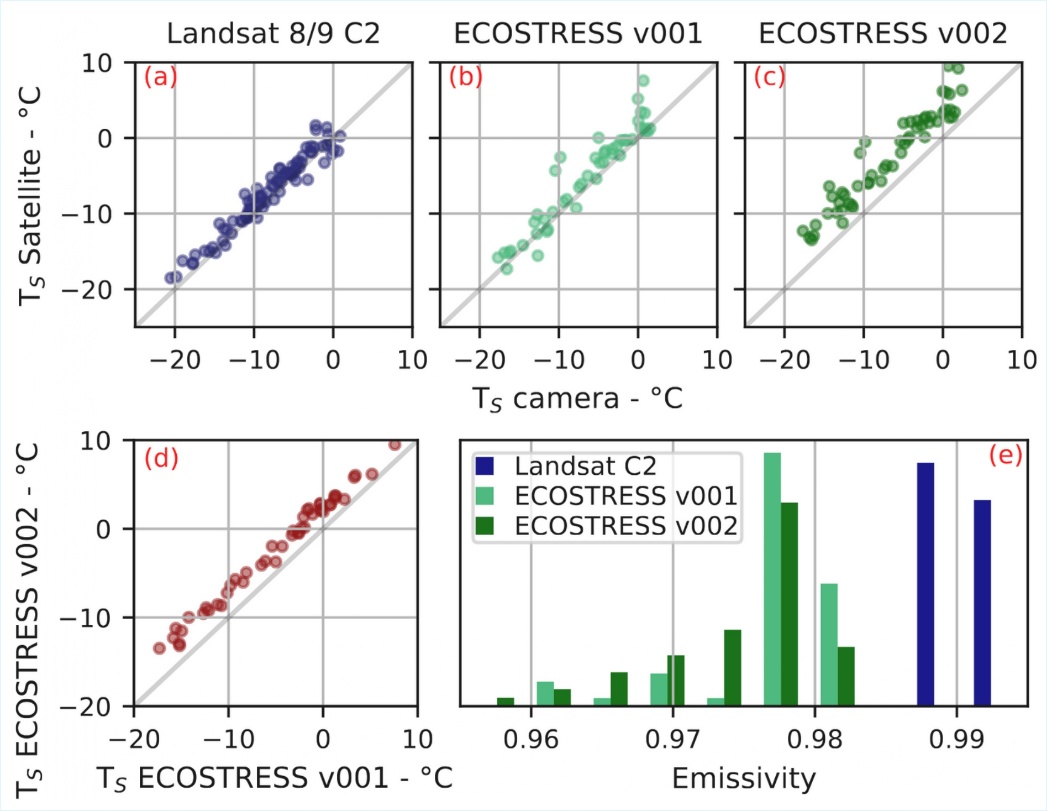
Figure 2: Comparison of snow surface temperatures from in-situ measurements and from Landsat 8/9 C2 (a), ECOSTRESS V001 (b) and V002 (c). (d) shows the comparison between ECOSTRESS LST issued from the same images but processed in V001 and V002. (e) shows the emissivities used for LST retrieval of Landsat C2 (Band 10, 10.9 µm) and ECOSTRESS V001 and V002 (Band 4, 10.5 µm).
5. Discussion
The comparison reveals a warm bias of all remote sensing products with respect to in situ measurements, but with different amplitudes. For Landsat, our comparison is consistent with previous findings for other surface types by Eon et al. (2023), who performed a thorough temperature-based validation of L8 and L9 LST products and found an accuracy of <1 K over water and <2 K for sand dunes. In addition, this error is within the expected 2% accuracy of the product, corresponding to approximately 1.4 K for targets at 273.15 K (Pearlman et al. 2022). The RMSE of our comparison — 1.28 K —, suggests that the performance of Landsat 8/9 C2 LST products over snow-covered areas is equivalent to that found in other studies on warmer surfaces. Finally, our results are also compatible with those from Gök et al. (2024), that compared Landsat 8 LST products with SnowST from 119 weather stations across the Alps and found a bias of +0.05 ± 4.26 K.
ECOSTRESS V001 images have an average warm bias of +1.24 K compared to ground measurements and an RMSE of 1.52 K. These values are higher than for Landsat and exceed the declared precision and accuracy goals of 0.3 K and 1.0 K for the sensor (Hulley and Hook, 2015), and the <1 K accuracy declared in the Quality Control layer the LST product for all images. In a similar study, Hulley et al. (2021) found a lower RMSE of 1.07 K and a MAE of 0.40 K over a large range of surfaces like water, rocks, sand, grassland and forest. However, they found a cold bias of 0.75 K for temperatures under 295 K due to calibration issues. As 295 K approximately corresponds to the temperature of the coldest blackbody used for internal calibration, it is possible that the performance of ECOSTRESS is worse on colder surfaces such as snow. Still, with both the bias and the RMSE <2 K, its performance is only slightly lower than Landsat C2, which is satisfactory for a sensor designed to operate over warm targets.
In contrast, the bias of ECOSTRESS V002, +3.91 ± 1.32 K is significantly higher than that measured for Landsat and ECOSTRESS V001. This result is in line with Zhang et al. (2025), according to which the correction of a ≈2 K cold bias, observed in V001 LST for temperatures between 270 K and 300 K, caused a systematic overestimation >2 K of temperatures below 270 K. The narrow distribution of the V002 LST with respect to V001 LST (RMSE of 0.74 K) in Fig. 2d confirms the bias-like nature of the error between the two LST collections. These changes compromise the performance of ECOSTRESS LST product over snow-covered areas by increasing the MAE from +1.24 K to +3.91 K. As processing of new acquisitions into V001 stopped in January 2025, understanding and correcting this high error in upcoming collections would extend the possible exploitation of ECOSTRESS LST over snow and other cold surfaces of several years (potential operation until 2029).
Various previously cited studies consistently reported a cold bias in MODIS LST products over snow (Hall et al. 2008, Westermann et al. 2012, Hall et al. 2018), in contrast with the warm bias found for both Landsat and ECOSTRESS LST products. Several factors may cause this discrepancy. First, Li et al. (2023) performed an intercomparison between MODIS LST products (MOD11A1 and MYD11A1) and twelve other extensively used LST products and found a warm bias of all LST compared to MODIS over snow and ice. Second, Hall et al. (2008), Westermann et al. (2012), Hall et al. (2018) performed their validation over areas of gentle topography, while the rough topography surrounding our study area strongly impacts the radiative transfer, leading to potential overestimation of the measured LST, especially in valleys (Zhu et al. 2020). Finally, the atmosphere is also more complex in mountain areas (Yang et al. 2011).
The average emissivity in B10 (10.9 µm) used for Landsat LST retrieval, 0.99, is consistent with the literature, as most studies agree that the emissivity at this wavelength is around 0.99 (Dozier and Warren 1982, Hori et al. 2006) for most snow types and viewing zenith angles (VZA, 4.30° for LST acquired from Path 195, 6.20° for LST acquired from Path 196). Moreover, emissivity is reasonably constant among images (variations <0.002), meaning that bias variations among images cannot be explained by fluctuations in emissivity.
Like Landsat’s B10, ECOSTRESS B4 emissivities (10.5 µm) used for the LST retrieval of V001 and V002 are expected to have values around 0.99 (Dozier and Warren 1982, Salisbury et al. 1994). However, they are always lower for ECOSTRESS products, and span a broader range of values, 0.9460 to 0.9820. These low values may be due to an inaccurate estimation of the Minimum-Maximum spectral Difference of the emissivity (MMD) in the TES algorithm. This algorithm tends to overestimate the MMD for gray-bodies, as the small spectral contrast of the emissivity may be buried in measurement noise and errors in atmospheric correction (often inaccurate over mountain terrain, Richter 1997, Hulley and Hook 2015). Snow behaves as a gray-body when fine-grained or observed from viewing zenith angles (VZA) close to nadir. For coarse-grained snow or sun-crust and for higher VZA, a small MMD (0.02 to 0.05) may arise from the lower snow emissivity at ECOSTRESS B5 at 12.1 µm (Hori et al. 2006). Still, the MMD empirical calibration curve was developed using the ECOSTRESS Spectral Library v1.0 (Meerdink et al. 2019), that only contains three spectra for snow (fine, medium and coarse-grained) from observed 10° directional hemispherical reflectance in the TIR range, while ECOSTRESS LST used in this study have VZA between 8.4° and 26.9°, with an average of 16.6° (plus the local slope). This could explain the frequent mis-classification of the surface type based on the MMD (contained in the Quality Control layer) over our AOIs. Indeed, on average, 67% and 73% of AOI pixels were classified as “Rocks, sand, some soils” instead of “Vegetation, snow, water, ice”. In the lack of a better characterization of the snow emissivity and its variability, the simple NDSI-based determination of the emissivity used for Landsat seems advantageous. The estimation of the NDSI requires radiance observation in short-wave bands which ECOSTRESS lacks. Our results suggest that NDSI estimation could benefit LST retrieval of future TIR missions such as TRISHNA and LSTM, whose instruments will measure in the TIR, visible and near-infrared bands (Roujean et al. 2021, Koetz et al. 2018).
6. Conclusions
This study evaluates high-resolution Land Surface Temperature products from Landsat-8/9 TIRS/2 — Collection 2 — and ECOSTRESS — Version 1 and 2 — against accurate snow surface temperature maps acquired in an Alpine site. The analysis shows a warm bias in all satellite products. Landsat 8/9 LST presents a bias of +1.06 ± 1.28 K, confirming that the TIRS/2 instruments and the retrieval algorithm perform well within the nominal error of <2% over mountainous snow-covered areas. For ECOSTRESS, the observed bias increases to +1.24 ± 1.52 K for V001 and +3.91 ± 1.32 K for V002. The degraded performance of V002 is probably due to the correction of a cold bias observed for temperatures >270 K in V001. However, V001 LST also does not exactly meet the goals of 1.0 K accuracy and 0.3 K precision set for the LST retrieval algorithm. Our results also highlight an underestimation of ECOSTRESS Band 4 emissivity used for LST recovery. This may be due to limitations of the temperature-emissivity separation algorithm over gray bodies, but also to the lack of directional emissivity spectra of snow in the ECOSTRESS Spectral Library v1.0. As both the physical properties of snow and the acquisition geometry impact the shape of snow emissivity spectra, the single channel method used for Landsat LST retrieval, that includes a NDSI-based (Normalized Difference Snow Index) land cover classification used to choose emissivity values, yields more accurate results. Our study suggests that this simple approach is therefore still suitable for snow-covered areas and should be considered for the next-generation TIR sensors on board the TRISHNA and LSTM satellites as long as more complex algorithms are not stabilized for snow. In general, our evaluation provides a framework for the exploitation of Landsat and ECOSTRESS LST products over snow-covered mountain terrain. Also, by illustrating the link between LST accuracy, LST retrieval method and surface characteristics, it highlights the need of a critical use of LST products over snow-covered mountain areas, in order to improve cryospheric applications.
Author Contributions
Sara Arioli: conceptualization, data curation, formal analysis, investigation, methodology, resources, software, validation, writing – original draft, writing – review & editing. Ghislain Picard: funding acquisition, methodology, project administration, supervision, writing – review & editing. Simon Gascoin: funding acquisition, methodology, project administration, supervision, writing – review & editing. Laurent Arnaud: resources, software, supervision, validation, writing – review & editing.
Declaration of competing interest
The authors declare that they have no known competing financial interests or personal relationships that could have appeared to influence the work reported in this paper.
Funding
This study has been supported by the Centre National d’Etudes Spatiales (TRISHNA) and the European Space Agency (4D Antarctica). It has benefited from the use of the infrastructures of the Lautaret Garden – UAR 3370 (Univ. Grenoble Alpes, CNRS, 38000 Grenoble, France), a member of AnaEE France and of the eLTER European network.
References
Alonso-González, E., Gascoin, S., Arioli, S., and Picard, G., 2023. Exploring the potential of thermal infrared remote sensing to improve a snowpack model through an observing system simulation experiment. The Cryosphere, 17, 3329–3342. https://doi.org/10.5194/tc-17-3329-2023
Arioli, S., Picard, G., Arnaud, L., 2024a. Timeseries of the snow surface temperature acquired at the Col du Lautaret (French Alps) during winter 2021-2022 with an uncooled thermal infrared camera – V2 -UTC. https://doi.org/10.57932/8ed8f0b2-e6ae-4d64-97e5-1ae23e8b97b1 (accessed 07/01/2026).
Arioli, S., Picard, G., Arnaud, L., 2024b. Timeseries of the snow surface temperature acquired at the Col du Lautaret (French Alps) during spring 2023 with an uncooled thermal infrared camera – V2 -UTC. https://doi.org/10.57932/1e9ff61f-1f06-48ae-92d9-6e1f7df8ad8c (accessed 07/01/2026).
Arioli, S., Picard, G., Arnaud, L., Gascoin, S., Alonso-González, E., Poizat, M., Irvine, M., 2024c. Time series of alpine snow surface radiative-temperature maps from high-precision thermal-infrared imaging. Earth System Science Data, 16, 3913–3934. https://doi.org/10.5194/essd-16-3913-2024
Colombo, R., Garzonio, R., Di Mauro, B., Dumont, M., Tuzet, F., Cogliati, S., Pozzi, G., Maltese, A., Cremonese, E., 2019. Introducing thermal inertia for monitoring snowmelt processes with remote sensing. Geophysical Research Letters, 46, 4308–4319. https://doi.org/10.1029/2019GL082193
Colombo, R., Pennati, G., Pozzi, G., Garzonio, R., Di Mauro, B., Giardino, C., Cogliati, S., Rossini, M., Maltese, A., Pogliotti, P., Cremonese, E., 2023. Mapping snow density through thermal inertia observations. Remote Sensing of Environment, 284, 113323. https://doi.org/10.1016/j.rse.2022.113323
Dozier, J., Warren, S. G., 1982. Effect of viewing angle on the infrared brightness temperature of snow. Water resources research, 18 (5), 1424-1434. https://doi.org/10.1029/WR018i005p01424
Eon, R., Gerace, A., Falcon, L., Poole, E., Kleynhans, T., Raqueño, N., Bauch, T., 2023. Validation of landsat-9 and landsat-8 surface temperature and reflectance during the underfly event. Remote Sensing, 15 (13), 3370. https://doi.org/10.3390/rs15133370
Gök, D. T., Scherler, D., and Wulf, H., 2024. Land surface temperature trends derived from Landsat imagery in the Swiss Alps, The Cryosphere, 18, 5259–5276. https://doi.org/10.5194/tc-18-5259-2024
Hall, D. K., Box, J. E., Casey, K. A., Hook, S. J., Shuman, C. A., Steffen, K., 2008. Comparison of satellite-derived and in-situ observations of ice and snow surface temperatures over Greenland. Remote Sensing of Environment, 112 (10), 3739–3749. https://doi.org/10.1016/j.rse.2008.05.007
Hall, D. K., Cullather, R. I., DiGirolamo, N. E., Comiso, J. C., Medley, B. C., Nowicki, S. M., 2018. A multilayer surface temperature, surface albedo, and water vapor product of Greenland from MODIS. Remote Sensing, 10 (4), 555. https://doi.org/10.3390/rs10040555
Halverson, G., Cawse-Nicholson, K., Fisher, J., Johnson, M., Hulley, G., Freepartner, R., Smyth, M., Logan, T., Purdy, A., Ryu, Y., Colliander, A., Lee, C., Freeborn, D., Hook, S., 2021. Improvements to ECOSTRESS Algorithms and Products in Collection 2. AGU Fall Meeting Abstract Book, 2021. https://ui.adsabs.harvard.edu/abs/2021AGUFMGC12A..07H
Hori, M., Aoki, T., Tanikawa, T., Motoyoshi, H., Hachikubo, A., Sugiura, K., Yasunari, T. J., Eide, H., Storvold, R., Nakajima, Y., Takahashi, F., 2006. In-situ measured spectral directional emissivity of snow and ice in the 8–14 μm atmospheric window. Remote Sensing of Environment, 100 (4), 486-502. https://doi.org/10.1016/j.rse.2005.11.001
Hulley, G., Hook, S. E., 2015. Level-2 Land Surface Temperature and Emissivity Algorithm Theoretical Basis Document (ATBD). Technical Report. Jet Propulsion Laboratory, California Institute of Technology: Pasadena, CA, USA. https://ecostress.jpl.nasa.gov/data/atbds-summary-table (accessed 07/01/2026).
Hulley, G. C., Göttsche, F. M., Rivera, G., Hook, S. J., Freepartner, R. J., Martin, M. A., Cawse-Nicholson, K., Johnson, W. R. (2021). Validation and quality assessment of the ECOSTRESS level-2 land surface temperature and emissivity product. IEEE Transactions on Geoscience and Remote Sensing, 60, 1-23. https://doi.org/10.1109/TGRS.2021.3079879
Kraaijenbrink, P. D., Shea, J. M., Litt, M., Steiner, J. F., Treichler, D., Koch, I., Immerzeel, W. W., 2018. Mapping surface temperatures on a debris-covered glacier with an unmanned aerial vehicle. Frontiers in Earth Science, 6, 64. https://doi.org/10.3389/feart.2018.00064
Koetz, B., Bastiaanssen, W., Berger, M., Defourney, P., Del Bello, U., Drusch, M., Drinkwater, M., Duca, R., Fernandez, V., Ghent, D., Guzinski, R., Hoogeveen, J., Hook, S., Lagouarde, J. P., Lemoine, G., Manolis, I., Martimort, P., Masek, J., Massart, M., Notarnicola, C., Sobrino, J., Udelhoven, T., 2018. High spatio-temporal resolution land surface temperature mission – a Copernicus candidate mission in support of agricultural monitoring. 2018 IEEE International Geoscience and Remote Sensing Symposium (IGARSS), 8160–8162. https://doi.org/10.1109/IGARSS.2018.8517433
Langer, M., Westermann, S., Boike, J., 2010. Spatial and temporal variations of summer surface temperatures of wet polygonal tundra in Siberia-implications for MODIS LST based permafrost monitoring. Remote Sensing of Environment, 114 (9), 2059-2069. https://doi.org/10.1016/j.rse.2010.04.012
Li, Z.-L., Wu, H., Duan, S.-B., Zhao, W., Ren, H., Liu, X., Leng,, P., Tang, R., Ye, X., Zhu, J., Sun, Y., Si, M., Liu, M., Li, J., Zhang, X., Shang, G., Tang, B.-H., Yan, G., Zhou, C., 2023. Satellite remote sensing of global land surface temperature: Definition, methods, products, and applications. Reviews of Geophysics, 61 (1), e2022RG000777. https://doi.org/10.1029/2022RG000777
Lundquist, J. D., Cayan, D. R., 2007. Surface temperature patterns in complex terrain: Daily variations and long‐term change in the central Sierra Nevada, California. Journal of Geophysical Research: Atmospheres, 112 (D11). https://doi.org/10.1029/2006JD007561
Meerdink, S. K., Hook, S. J., Roberts, D. A., & Abbott, E. A., 2019. The ECOSTRESS spectral library version 1.0. Remote Sensing of Environment, 230, 111196. https://doi.org/10.1016/j.rse.2019.05.015
Pearlman, A., Efremova, B., Montanaro, M., Lunsford, A., Reuter, D., & McCorkel, J., 2022. Landsat 9 thermal infrared sensor 2 on-orbit calibration and initial performance. IEEE Transactions on Geoscience and Remote Sensing, 60, 1-8. https://doi.org/10.1109/TGRS.2022.3183551
Richter, R., 1997. Correction of atmospheric and topographic effects for high spatial resolution satellite imagery. International journal of remote sensing, 18 (5), 1099-1111. https://doi.org/10.1080/014311697218593
Robledano, A., Picard, G., Arnaud, L., Larue, F., and Ollivier, I., 2022. Modelling surface temperature and radiation budget of snow-covered complex terrain. The Cryosphere, 16, 559–579. https://doi.org/10.5194/tc-16-559-2022
Roujean, J.-L., Bhattacharya, B., Gamet, P., Pandya, M. R., Boulet, G., Olioso, A., Singh, S. K., Shukla, M. V., Mishra, M., Babu, S., Raju, P. V., Murthy, C. S., Briottet, X., Rodler, A., Autret, E., Dadou, I., Adlakha, D., Sarkar, M., Picard, G., Kouraev, A., Ferrari, C., Irvine, M., Delogu, E., Vidal, T., Hagolle, O., Maisongrande, P., Sekhar, M., Mallick, K., 2021. TRISHNA: An indo-french space mission to study the thermography of the earth at fine spatio-temporal resolution. 2021 IEEE International India Geoscience and Remote Sensing Symposium (InGARSS), 49–52. https://doi.org/10.1109/InGARSS51564.2021.9791925
Salisbury, J. W., D’Aria, D. M., & Wald, A., 1994. Measurements of thermal infrared spectral reflectance of frost, snow, and ice. Journal of Geophysical Research: Solid Earth, 99 (B12), 24235-24240. https://doi.org/10.1029/94JB00579
Westermann, S., Langer, M., Boike, J., 2012. Systematic bias of average winter-time land surface temperatures inferred from modis at a site on svalbard, Norway. Remote Sensing of Environment, 118, 162–167. https://doi.org/10.1016/j.rse.2011.10.025
Wigmore, O., Molotch, N. P., 2023. Weekly high-resolution multi-spectral and thermal uncrewed-aerial-system mapping of an alpine catchment during summer snowmelt, Niwot Ridge, Colorado. Earth System Science Data, 15, 1733–1747. https://doi.org/10.5194/essd-15-1733-2023
Yang, Z., Hanna, E., & Callaghan, T. V., 2011. Modelling surface‐air‐temperature variation over complex terrain around Abisko, Swedish Lapland: uncertainties of measurements and models at different scales. Geografiska Annaler: Series A, Physical Geography, 93 (2), 89-112. https://doi.org/10.1111/j.1468-0459.2011.00005.x
Zhang, H., Mahmood, A. N., Hu, T., Mallick, K., Didry, Y., Hitzelberger, P., Szantoi, Z., Pérez-Planells, L., Göttsche, F. M., Hulley, G. C., Hook, S. J., 2025. Global evaluation of high-resolution ECOSTRESS land surface temperature and emissivity products: Collection 1 versus Collection 2. Remote Sensing of Environment, 326, 114799. https://doi.org/10.1016/j.rse.2025.114799
Zhu, X., Duan, S. B., Li, Z. L., Zhao, W., Wu, H., Leng, P., Maofang, G., Zhou, X., 2020. Retrieval of land surface temperature with topographic effect correction from Landsat 8 thermal infrared data in mountainous areas. IEEE Transactions on Geoscience and Remote Sensing, 59 (8), 6674-6687. https://doi.org/10.1109/TGRS.2020.3030900
Publisher’s Note
The statements, opinions, and data contained in all publications are solely those of the individual author(s) and contributor(s) and not of Recent Advances S.L. and/or the editor(s). Recent Advances S. L. and/or the editor(s) disclaim responsibility for any injury to people or property resulting from any ideas, methods, instructions, or products referred to in the content.