



Assessing the Potential of Land Surface Emissivity for Land Cover Classification
Xiujuan Li

1,2,3, José Antonio Sobrino
2, Hua Wu
1,3,4*- School of Resources and Environment, University of Electronic Science and Technology of China, Sichuan 610054, China.
- Global Change Unit, Image Processing Laboratory, University of Valencia, Valencia 46980, Spain.
- State Key Laboratory of Resources and Environmental Information System, Institute of Geographic Sciences and Natural Resources Research, Chinese Academy of Sciences, Beijing 100101, China.
- University of Chinese Academy of Sciences, Beijing 100049, China.
* Author to whom correspondence should be addressed.

Abstract
As an inherent property of natural materials, Land Surface Emissivity (LSE) varies across different land surface materials, serving as an indicator of the composition and changes in land covers. However, due to the limitations in sensor level, there were few studies on land surface classification based on LSE. With the development of hyperspectral thermal infrared (TIR) remote sensing, research on land surface classification using emissivity spectra is expected to be put on the agenda. Therefore, this study examined the potential of land cover classification using the LSEs of 17 types selected from ECOSTRESS spectral database. The analysis was conducted using the Spectral Angle Mapper (SAM) method and the Munn-Whitney U (MWU) test. Results showed that some land cover types had distinct separability in LSE spectra, particularly for alfisol, entisol, tree, lichen, flower and igneous rock. Moreover, most of the soil and vegetation used in this study exhibited a significant difference (exceeding 70%) across wavelengths. However, some surfaces remain indistinguishable, such as different types of man-made surfaces. In general, land surface classification using emissivity spectra has great development potential. Nevertheless, this study only analyzes a subset of land surfaces, which is a limitation. In the future, more in-depth analysis should be conducted using a wider variety of data types.Keywords
Land cover classification, land surface emissivity, Hyperspectral thermal infrared remote sensing1. Introduction
Monitoring and classifying land cover and its dynamic changes are the foundation of many fields, such as environmental sciences, resource management, and sustainable development (Andrew et al. 2014; Meng et al. 2022; Radeloff et al. 2024). Traditional remote sensing methods for land cover classification mainly rely on the reflectance properties of surface materials. Specifically, they use reflectance spectra in the visible, near-infrared, and shortwave infrared bands to classify the surface types. Over the past few decades, these reflectance-based methods have achieved great success. They have led to many mature classification algorithms and practical products (Chen and Chen 2018; Xie et al. 2019; Zhang et al. 2016). Even so, this traditional approach has some limitations. On one hand, the same object may have different spectra and different objects may have same spectra. For example, different vegetation may exhibit highly similar green spectral characteristics during the growing season, while man-made construction materials of varying compositions may be difficult to distinguish in the visible band. On the other hand, reflectance spectra primarily capture the optical properties of surface materials. Their ability to reveal the intrinsic material composition and physical properties of these materials is limited.
As an inherent physical property of surface materials, the spectral features of land surface emissivity (LSE) in the Thermal Infrared (TIR) band offers another way to distinguish land cover types (Ni et al. 2020). The shape of the LSE along with the position and depth of its absorption valleys, is directly linked to the property of materials. Therefore, LSE spectra can provide richer information for surface classification studies, especially when the reflectivity of certain features is relatively similar. For instance, some minerals, like quartz and feldspar, do not show significant reflectivity features in the visible to shortwave infrared (VSWIR) range but demonstrate unique spectral characteristics in the TIR region (Chen et al. 2007; Kruse 2015). For such features that cannot be distinguished by reflectivity spectra, studying their emissivity spectra can further expand and deepen the related researches (Hecker et al. 2019; Obrecht et al. 2024; Rock et al. 2016). Specifically, this approach can help identify the chemical composition and physical structure of materials, such as some mineral components like silicates and carbonates, as well as surface roughness, particle size, and porosity. This ability to directly respond to the intrinsic composition of materials makes LSE spectra valuable in many fields, including geological surveys, soil analysis, urban impervious surface material identification, and vegetation stress monitoring.
TIR remote sensing remains the primary way to obtain LSE (Li et al. 2023; Li et al. 2013). However, the spectral resolution of TIR sensors was relatively low for a long time in the past. Most sensors could only provide a single emissivity value or a few discrete spectral points, which limited the study of land cover classification using LSE (Hua et al. 2021). In recent years, the advent of hyperspectral TIR remote sensing has enabled the acquisition of continuous emissivity spectra, offering great prospects for further advancing research on surface classification. However, there are few systematic studies that evaluated the feasibility of land cover classification using emissivity spectra.
Therefore, based on the ECOSTRESS spectral library, this study quantitatively analyzes the differences and similarities in emissivity spectra between different surface types. The primary objective is to identify which types possess great separability in the hyperspectral TIR dimension. Furthermore, machine learning method was integrated to verify the classification accuracy based on LSE spectra, thereby empirically testing the accuracy level achievable in land cover classification using hyperspectral emissivity data
2. Materials and Methods
2.1. LSE from ECOSTRESS spectral library
The emissivity data utilized in this study were obtained from the ECOSTRESS spectral library. To investigate the separability of some common land cover types, a total of 95 spectra belonging to 17 land cover categories were selected. The samples consist of four soil types (Alfisol, Aridisol, Entisol, and Inceptisol), water body type, five vegetation types (Grass, Tree, Shrub, Lichen, and Flowers), three rock types (Igneous rocks, Metamorphic rocks, and Sedimentary rocks), and four manmade surface types (Concrete samples, General construction material samples, Road samples, and Roofing material samples).
The emissivity spectral shapes of different land cover types are illustrated in figure 1. For the four soil types, their spectral shapes are relatively similar. All of them exhibit absorption valleys between 8-8.5 μm and 9-9.5 μm, a reflection peak between 8.5-9 μm. However, certain differences exist among them. For instance, Alfisol and Inceptisol have a narrower range of emissivity values, while Aridisol and Entisol show more significant fluctuations between valleys and peaks. These differences may serve as bases for distinguishing between different soil types.The emissivity spectral curves of different vegetation types vary considerably. Among them, the spectral shapes of grass and trees are relatively similar, with grass exhibiting more serrated fluctuations. In contrast, the emissivity spectra of shrubs, lichens, and flowers are relatively flat. The emissivity spectral shape of water bodies mainly shows a trend of first increasing and then decreasing, with the overall emissivity value range between 0.98 and 0.99. Notablely, some of rock and manmade types (e.g., sedimentary rocks, concrete, and road surfaces) exhibit spectral shapes similar to those of soils, which may lead to misclassification of data.
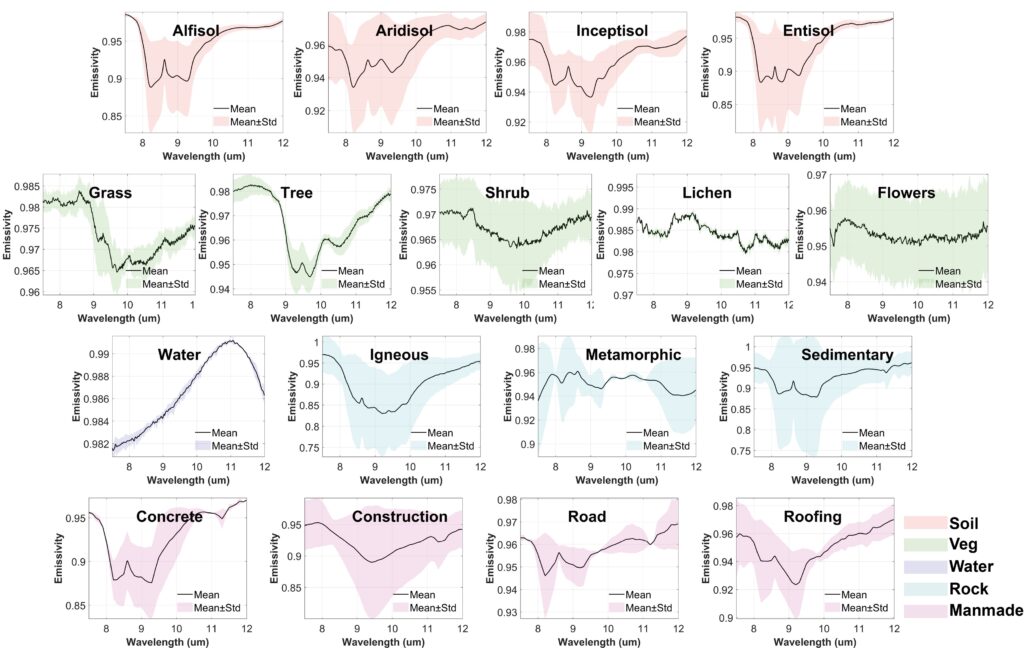
Figure 1. The spectral shape of selected LSE samples.
2.2. Methods
A. Spectral Angle Mapper
Spectral Angle Mapper (SAM) was used to test the similarity among different LSE spectra. SAM is a supervised classification algorithm based on spectral waveform similarity (Hecker et al. 2008; Meerdink et al. 2019). Its core principle involves calculating the angle between the spectral vectors of two surface features. A smaller angle indicates a higher spectral similarity between the two features, meaning they are more likely to belong to the same category. SAM computes the angle θ between two spectral vectors using the cosine law, with the formula given as follows:
where, θ represents the spectral angle between two emissivity spectra. xi and yi (i=1, 2, … , n)are the emissivity spectra of n TIR bands.
B. Mann-Whitney U Test
In this study, the Mann-Whitney U (MWU) test was employed to calculate the differences between emissivity spectra. The MWU test is one of the most commonly used non-parametric statistical methods, primarily applied to compare whether there are significant differences in the population distributions of two independent samples (Bin Othman and Heng 2014; Kasuya 2001; Korneev and Krichevets 2011). This method can be used for analyzing ordinal categorical data or continuous data. Based on the results of MWU test, separability was evaluated from two aspects (Meerdink et al. 2019). Firstly, the proportion of bands with significant differences between each pair of spectra relative to the total number of bands was calculated. This proportion was used to assess the separability between two LSE spectra. Secondly, the number of surface types that could be distinguished from a given surface type at a specific band was counted. This count can help to identify the characteristic bands of the given type.
C. Land Cover Classification
In this study, random forest (RF) classification was employed for land cover classification based on emissivity spectra. RF classification is a supervised learning algorithm rooted in the concept of ensemble learning (Sparey et al. 2024; Zhang and Roy 2017). Its core lies in constructing multiple decision trees and integrating their prediction results to enhance classification accuracy and stability. This method can effectively address the shortcomings of a single decision tree, such as proneness to overfitting and weak generalization ability. To better simulate current retrieval accuracy of emissivity, Gaussian white noise with a standard deviation of 0.02 was added to each emissivity spectrum for 1000 times. The error level was determined with reference to the accuracy of existing emissivity retrieval methods and products (Hulley et al. 2014; Li et al. 2024; Malakar and Hulley 2016; Sobrino et al. 2008). Subsequently, the dataset was divided into the training set (accounting for 70%) and test set (accounting for 30%). Furthermore, based on this sample set, the accuracy of land cover classification using emissivity spectra was explored.
3. Results
3.1. Spectral Angle of different LSEs
Using the SAM method, the shape differences in the emissivity spectra were analyzed. The results indicated that the spectral angles between most land cover types were relatively small, suggesting a certain degree of difficulty in classification. Among these types, alfisol, entisol, igneous rocks, sedimentary rocks, and concrete sample exhibited relatively larger spectral angles compared to other land cover types, demonstrating better spectral separability (Figure 2).
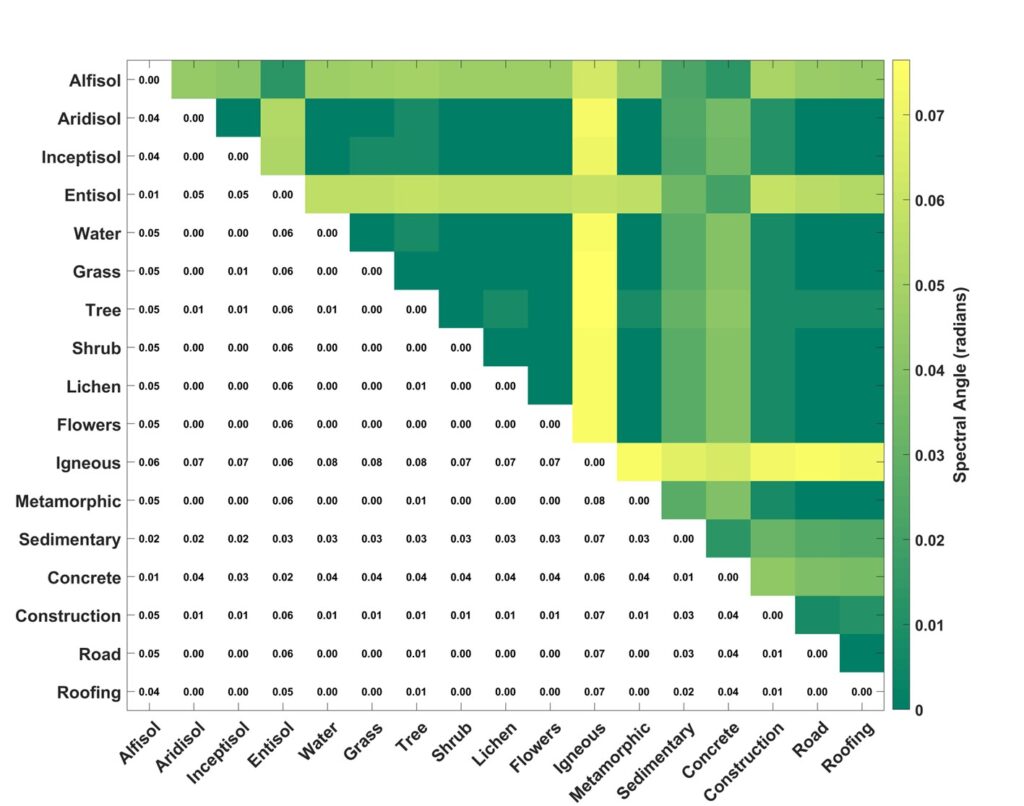
Figure 2. The SAM for different land cover types.
3.2 Species difference across various wavelengths.
MWU method was employed to assess the separability between each two land cover types. The results indicated that some land covers have obvious spectral differences in LSE spectra, particularly for alfisol, entisol, water, tree, lichen, flower and igneous rock. Moreover, most of the soil and vegetation show a significant emissivity difference of more than 70% in wavelength. But the species difference between the selected rock and man-made surfaces was relatively small. Especially, the subspecies were even more difficult to distinguish (Figure 3).
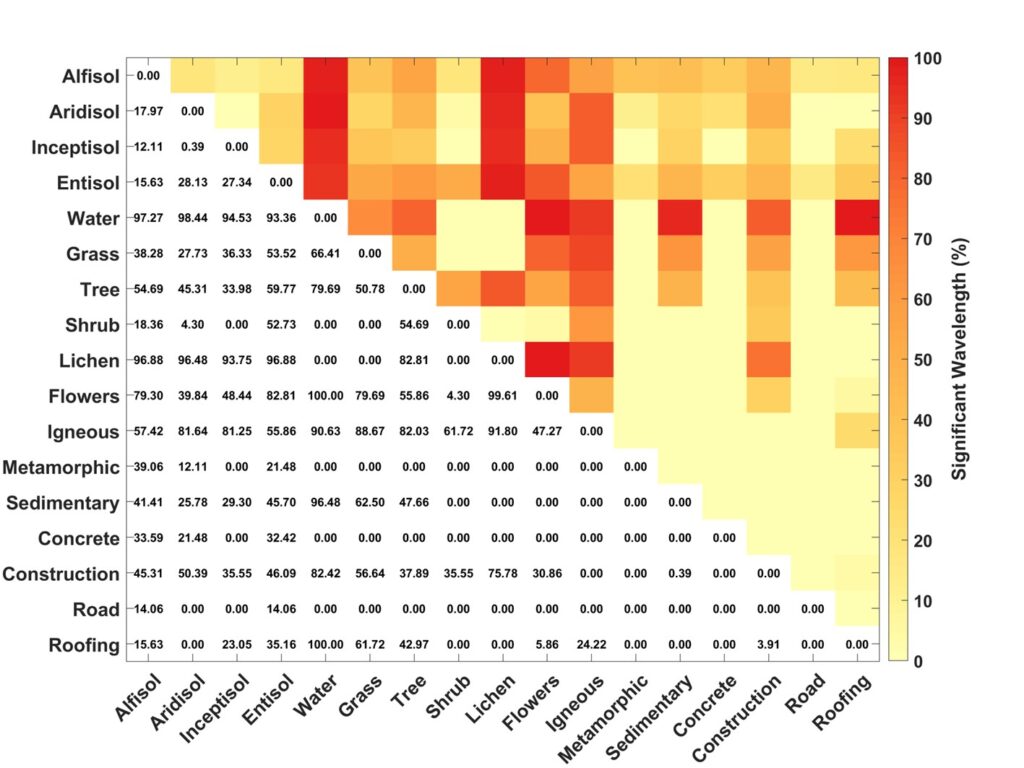
Figure 3. The proportion of bands with significant differences between each pair of spectra.
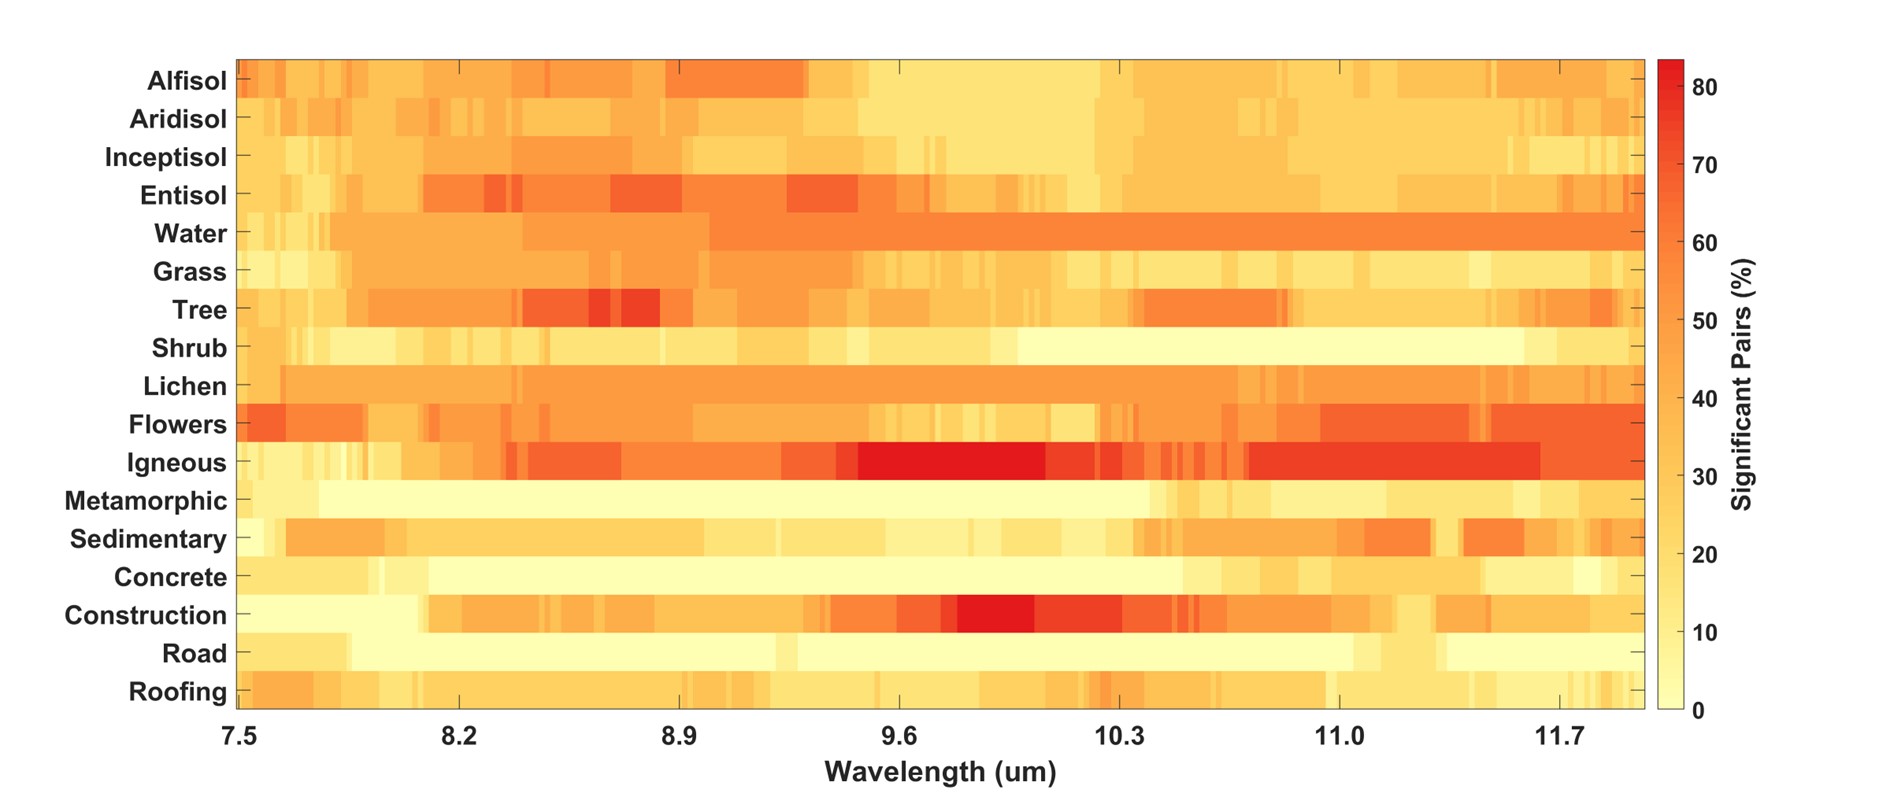
Moreover, the MWU test was employed to assess the species difference across various wavelengths. As the results, alfisol, entisol, water, tree, lichen, flower, igneous rock and construction showed obvious spectral differences in TIR spectra from other species. These distinctions can be attributed to the physical properties of these land cover types. For instance, water and lichen exhibit high emissivity in the TIR region, with values approaching 0.985. Alfisol and Entisol soils show fluctuating absorption peaks and valleys in the 8–9.5 μm range, and their emissivity values are below 0.9. Igneous rocks display a broad absorption valley in the 9-10 μm, where emissivity values drop below 0.85. It can be observed that the band-specific separability of land cover types is primarily influenced by their spectral absorption characteristics and emissivity value ranges. In contrast, the distinguishability of shrub, metamorphic rock, concrete and road were slightly lower compared to other feature, which may be due to overlapping emissivity values and similar shapes in certain TIR sub-bands. (Figure 4).
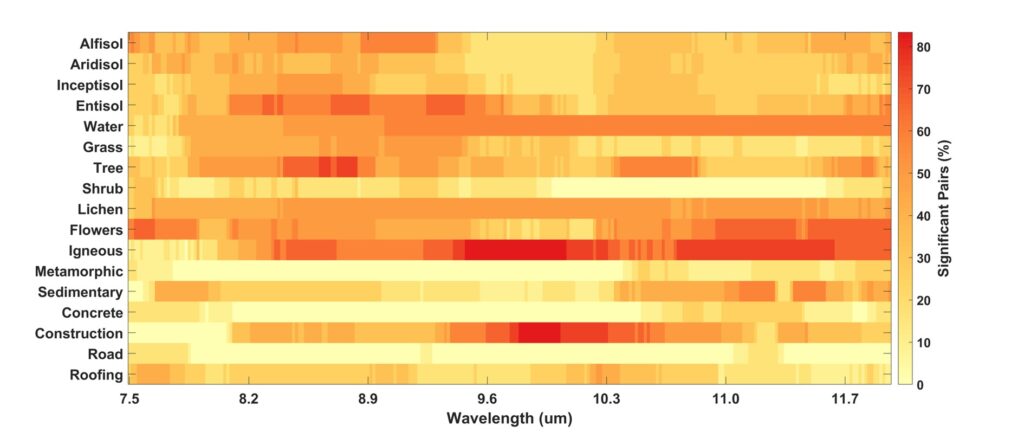
Figure 4. the species difference across various wavelengths.
3.3 Land cover classification using the retrieved LSE.
Based on RF classifier method, land cover classification was performed using the LSE samples. As the result, the overall accuracy of the model was 87%. The selected rock and manmade exhibited the best performance, while the selected soil and water showed moderate results. The poorest performance was observed in the vegetation samples. This may primarily because emissivity spectra of different vegetation types generally have similar shapes and value ranges, which reduces their separability. (Table 1, Figure 5).
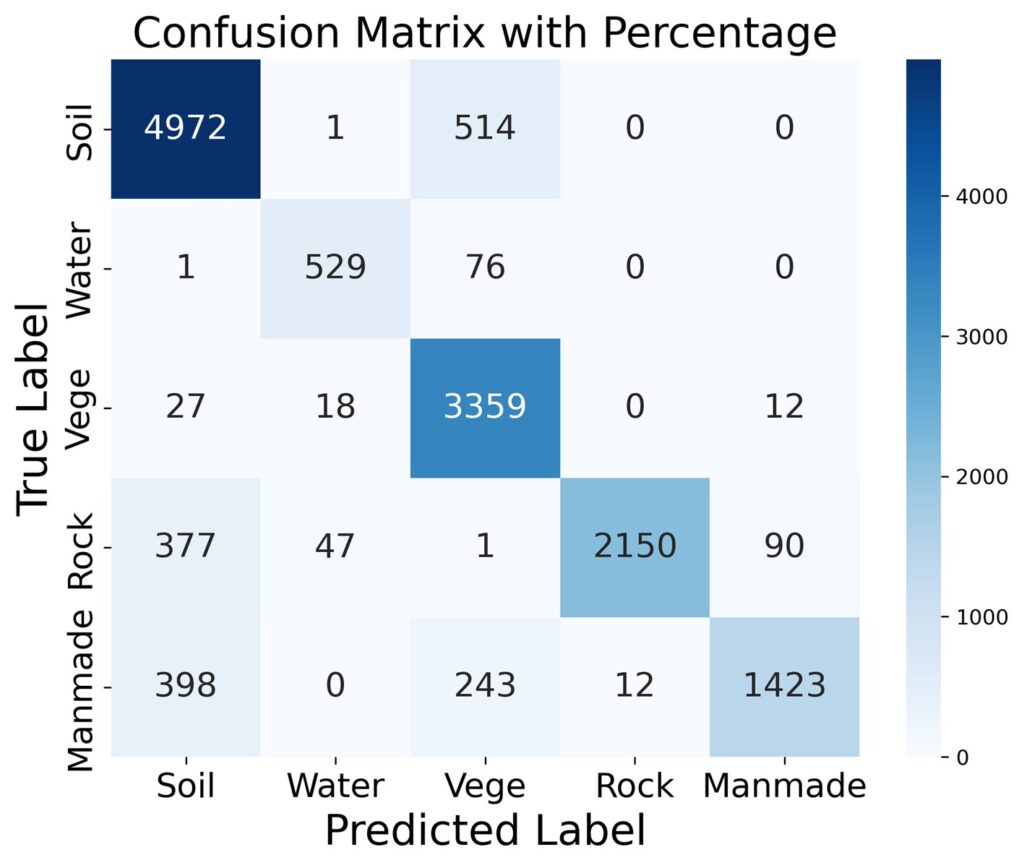
Figure 5. The confusion matrix of land cover classification.
Table 1. The accuracy of land cover classification.
| Type | Precision | Recall | F1-score | Support |
| Soil | 0.86 | 0.91 | 0.88 | 5487 |
| Water | 0.89 | 0.87 | 0.88 | 606 |
| Vegetation | 0.80 | 0.98 | 0.88 | 3416 |
| Rock | 0.99 | 0.81 | 0.89 | 2665 |
| Manmade | 0.93 | 0.69 | 0.79 | 2076 |
| Accuracy | 0.87 | 14250 | ||
| Macro Avg | 0.90 | 0.85 | 0.87 | 14250 |
| Weighted Avg | 0.88 | 0.87 | 0.87 | 14250 |
4. Discussion and Conclusions
In this study, the spectral separability of LSE was evaluated using the SAM method and the MWU test. The results demonstrated that certain classes exhibited relatively high spectral separability, like alfisol soil, entisol soil, water, tree, flower, igneous rock, and construction sample. Based on the LSE spectra, land cover classification was subsequently conducted employing the RF method, which achieved an overall accuracy of 87%. Overall, the use of emissivity for land surface classification showed considerable potential. Specifically, emissivity spectra have good separability across categories like minerals and artificial surfaces, making its application in research areas such as mineral mapping and urban material identification highly promising. However, it is notable that the sample size used in this study remains limited. This small sample size may restrict the robustness of our findings. For instance, it could reduce the reliability of the statistical relationships observed between emissivity features and land cover types. It may also compromise the generalizability of the results, as the used spectra might not fully represent the spectral variability of all target land cover types across different regions or environmental conditions. Therefore, future works should further expand the sample set to include more spectra from diverse study areas and land cover types, which will help enhance the robustness and generalizability of the research conclusions. Moreover, the feasibility of obtaining continuous emissivity spectra based on satellite TIR data and then applying them to the study of land cover classification also needs further discussion and verification. Simultaneously, analysis tailored to specific applications is also recommended, such as assessing the separability of different mineral types.
Author Contribution
Xiujuan Li: Writing – original draft, Conceptualization, Visualization, Validation. José Antonio Sobrino: Writing – review & editing, Resources, Supervision. Hua Wu: Writing – review & editing, Supervision, Funding acquisition.
Declaration of competing interest
The authors declare that they have no known competing financial interests or personal relationships that could have appeared to influence the work reported in this paper.
Acknowledgements
The authors thank the associated editor, and the reviewers for their thorough review and valuable comments.
Funding
This work was supported in part by the Strategic Priority Research Program of Chinese Academy of Sciences under grant No. XDA28050200, and in part by the Key Project of Innovation LREIS under grant No. KPI009 and by the project IPL Contribution to the Scientific Exploitation of the LSTM Mission (project number PID2023-150737OB-I00, IPL-HRTM).
References
Andrew, M.E., Wulder, M.A., & Nelson, T.A. (2014). Potential contributions of remote sensing to ecosystem service assessments. Progress in Physical Geography-Earth and Environment, 38, 328-353
Bin Othman, A.R., & Heng, L.C. (2014). Sensitivity analysis of the refinement to the Mann-Whitney U test. Sains Malaysiana, 43, 1095-1100
Chen, J., & Chen, J. (2018). GlobeLand30: Operational global land cover mapping and big-data analysis. Science China-Earth Sciences, 61, 1533-1534
Chen, X., Warner, T.A., & Campagna, D.J. (2007). Integrating visible, near-infrared and short-wave infrared hyperspectral and multispectral thermal imagery for geological mapping at Cuprite, Nevada. Remote Sensing of Environment, 110, 344-356
Hecker, C., van der Meijde, M., van der Werff, H., & van der Meer, F.D. (2008). Assessing the influence of reference spectra on synthetic SAM classification results. Ieee Transactions on Geoscience and Remote Sensing, 46, 4162-4172
Hecker, C., van Ruitenbeek, F.J.A., Bakker, W.H., Fagbohun, B.J., Riley, D., van der Werff, H.M.A., & van der Meer, F.D. (2019). Mapping the wavelength position of mineral features in hyperspectral thermal infrared data. International Journal of Applied Earth Observation and Geoinformation, 79, 133-140
Hulley, G., Veraverbeke, S., & Hook, S. (2014). Thermal-based techniques for land cover change detection using a new dynamic MODIS multispectral emissivity product (MOD21). Remote Sensing of Environment, 140, 755-765
Kasuya, E. (2001). Mann-Whitney U test when variances are unequal. Animal Behaviour, 61, 1247-1249
Korneev, A.A., & Krichevets, A.N. (2011). Conditions for student t-test and Mann-Whitney U-test application. Psikhologicheskii Zhurnal, 32, 97-110
Kruse, F.A. (2015). Integrated visible and near-infrared, shortwave infrared, and longwave infrared full-range hyperspectral data analysis for geologic mapping. Journal of Applied Remote Sensing, 9
Li, X., Wu, H., Ni, L., Li, J., Zhang, X., Fan, D., & Cheng, Y. (2024). A practical machine learning approach to retrieve land surface emissivity from space using visible and near-infrared to short-wave infrared data. International Journal of Applied Earth Observation and Geoinformation, 134
Li, Z.-L., Wu, H., Duan, S.-B., Zhao, W., Ren, H., Liu, X., Leng, P., Tang, R., Ye, X., Zhu, J., Sun, Y., Si, M., Liu, M., Li, J., Zhang, X., Shang, G., Tang, B.-H., Yan, G., & Zhou, C. (2023). Satellite remote sensing of global land surface temperature: Definition, methods, products, and applications. Reviews of Geophysics, 61
Li, Z.-L., Wu, H., Wang, N., Qiu, S., Sobrino, J.A., Wan, Z., Tang, B.-H., & Yan, G. (2013). Land surface emissivity retrieval from satellite data. International Journal of Remote Sensing, 34, 3084-3127
Malakar, N.K., & Hulley, G.C. (2016). A water vapor scaling model for improved land surface temperature and emissivity separation of MODIS thermal infrared data. Remote Sensing of Environment, 182, 252-264
Meerdink, S., Roberts, D., Hulley, G., Gader, P., Pisek, J., Adamson, K., King, J., & Hook, S.J. (2019). Plant species’ spectral emissivity and temperature using the hyperspectral thermal emission spectrometer (HyTES) sensor. Remote Sensing of Environment, 224, 421-435
Meng, S., Pang, Y., Huang, C., & Li, Z. (2022). Improved forest cover mapping by harmonizing multiple land cover products over China. Giscience & Remote Sensing, 59, 1570-1597
Ni, L., Xu, H., & Zhou, X. (2020). Mineral identification and mapping by synthesis of hyperspectral VNIR/SWIR and multispectral TIR remotely sensed data with different classifiers. Ieee Journal of Selected Topics in Applied Earth Observations and Remote Sensing, 13, 3155-3163
Obrecht, L., Goettsche, F.-M., Senn, J.A., & Cermak, J. (2024). Mapping Changes in Fractional Vegetation Cover on the Namib Gravel Plains with Satellite-Retrieved Land Surface Emissivity Data. Remote Sensing, 16
Radeloff, V.C., Roy, D.P., Wulder, M.A., Anderson, M., Cook, B., Crawford, C.J., Friedl, M., Gao, F., Gorelick, N., Hansen, M., Healey, S., Hostert, P., Hulley, G., Huntington, J.L., Johnson, D.M., Neigh, C., Lyapustin, A., Lymburner, L., Pahlevan, N., Pekel, J.F., Scambos, T.A., Schaaf, C., Strobl, P., Woodcock, C.E., Zhang, H.K., & Zhu, Z. (2024). Need and vision for global medium-resolution Landsat and Sentinel-2 data products. Remote Sensing of Environment, 300
Rock, G., Gerhards, M., Schlerf, M., Hecker, C., & Udelhoven, T. (2016). Plant species discrimination using emissive thermal infrared imaging spectroscopy. International Journal of Applied Earth Observation and Geoinformation, 53, 16-26
Sobrino, J.A., Jimenez-Munoz, J.C., Soria, G., Romaguera, M., Guanter, L., Moreno, J., Plaza, A., & Martincz, P. (2008). Land surface emissivity retrieval from different VNIR and TIR sensors. Ieee Transactions on Geoscience and Remote Sensing, 46, 316-327
Sparey, M., Williamson, M.S., & Cox, P.M. (2024). Machine learning for global bioclimatic classification: Enhancing land cover prediction through random forests. Atmosphere, 15
Wu, H., Li, X., Li, Z., Duan, S., & Qian, Y. (2021). Hyperspectral thermal infrared remote sensing: Current status and perspectives. National Remote Sensing Bulletin, 25, 1567-1590
Xie, S., Liu, L., Zhang, X., & Chen, X. (2019). Annual land-cover mapping based on multi-temporal cloud-contaminated landsat images. International Journal of Remote Sensing, 40, 3855-3877
Zhang, H.K., & Roy, D.P. (2017). Using the 500 m MODIS land cover product to derive a consistent continental scale 30 m Landsat land cover classification. Remote Sensing of Environment, 197, 15-34
Zhang, W., Chen, J., Liao, A., Han, G., Chen, X., Chen, L., Peng, S., Wu, H., & Zhang, J. (2016). Geospatial knowledge-based verification and improvement of GlobeLand30. Science China-Earth Sciences, 59, 1709-1719
Publisher’s Note
The statements, opinions, and data contained in all publications are solely those of the individual author(s) and contributor(s) and not of Recent Advances S.L. and/or the editor(s). Recent Advances S. L. and/or the editor(s) disclaim responsibility for any injury to people or property resulting from any ideas, methods, instructions, or products referred to in the content.