



Multitemporal assessment of burned areas and fire severity in Ourense (August 2025) using Sentinel-2 imagery
José Antonio Sobrino

*, Rafael Llorens
* Author to whom correspondence should be addressed.

Abstract
This study analyzes the burned area and fire severity of the forest fires that occurred in Ourense in August 2025. The analysis was based on Sentinel-2 imagery, which provides near-infrared (NIR) and short-wave infrared (SWIR) bands suitable for distinguishing between burned and unburned surfaces, as well as different severity levels. Several spectral indices widely applied in wildfire remote sensing were employed, including the Normalized Burn Ratio (NBR), the Burned Area Index for Sentinel-2 (BAIS2), and the Relativized Burn Ratio (RBR), together with their differential forms (e.g., dNBR). Temporal comparisons between pre- and post-fire conditions allowed a multitemporal assessment of fire progression and impact. Field plots were compared with the satellite-derived classification to evaluate accuracy (88%). The results demonstrate that Sentinel-2 data enable a precise delineation of burned areas and a reliable classification of severity levels in forest fires in Ourense. This study confirms the potential of satellite-based indices, supported by limited field validation, to provide rapid and accurate information for forest fires assessment and post-fire management.Keywords
Ourense, Sentinel-2, burned area, fire severity, multitemporal1. Introduction
Over the last decades, forest fires have become a major environmental problem due to their ecological, social, and economic impacts, with Spain being particularly vulnerable under climate change (Sobrino et al., 2019; Pausas and Keeley, 2019).). Beyond fire size, fire severity is a key parameter, reflecting the intensity of ecosystem damage (Keeley, 2009). Remote sensing has emerged as a reliable and efficient approach to monitor burned areas and assess fire severity, overcoming the limitations of traditional mapping techniques (Chuvieco et al., 2003; Key and Benson, 2006). Spectral indices based on near-infrared (NIR) and short-wave infrared (SWIR) bands, such as Normalized Burn Ratio (NBR), Burn Area Index (BAI), Burn Area Index Sentinel-2 (BAIS2), Relativized Burn Ratio (RBR), and Relative difference Normalized Burn Ratio (RdNBR), are particularly effective for detecting burned areas and evaluating severity, especially when pre-fire vegetation conditions are considered (Filipponi, 2018; Trigg and Flasse, 2001; Key & Benson, 2006; Parks et al., 2014; Miller and Thode, 2007).
During August of 2025, Ourense experienced one of its worst forest fire episodes in recent history. In just 16 days, over 100,000 hectares burned across Spain, with Ourense being one of the most affected provinces. Large fires, including the Larouco fire, devastated tens of thousands of hectares, crossed major rivers, destroyed property, and heavily impacted protected areas such as O Invernadeiro and Serra do Courel. These events highlighted the urgent need for rapid and accurate assessment tools to support fire management and ecological recovery.
This study applies the forest fires assessment methodology proposed by Sobrino et al., 2024 in Ourense: Sentinel-2 imagery combined with limited field validation to evaluate the burned area and fire severity. By providing detailed maps and temporal assessments, the work demonstrates the value of high-resolution satellite data for improving our understanding of fire impacts and strengthening national wildfire statistics.
2. Materials and Methods
2.1. Study Area
The work that is described was carried out in forest fires occurred in Ourense in August 2025. Those fires burned over 100000 Ha (Figure 1), classified mainly as Pinus pinaster Ait. (maritime pine) and Eucalyptus globulus Labill. (blue gum) stands. The understory vegetation was dominated by Pteridium aquilinum (L.) Kuhn and Ulex europaeus L. Forest fires are common in this region, which is the Spanish area most often affected by them. Figure 2 shows the burned area mapped by the European Forest Fire Information System (EFFIS), derived from Moderate-Resolution Imaging Spectroradiometer (MODIS) sensor (European Commission, Joint Research Center, 2025) with Sentinel-2 images, together with the land cover extracted from Sentinel-2 data for the Ourense forest fires that occurred in August, 2025 (Malinowski et al., 2024).
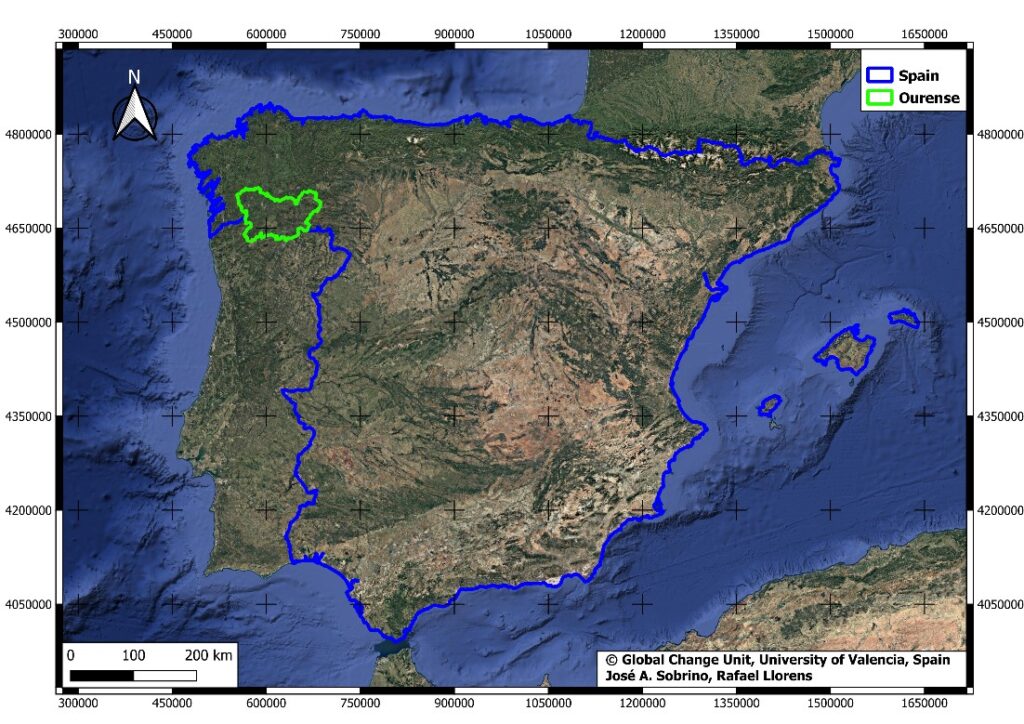
Figure 1. Study area focused on Ourense province, Spain
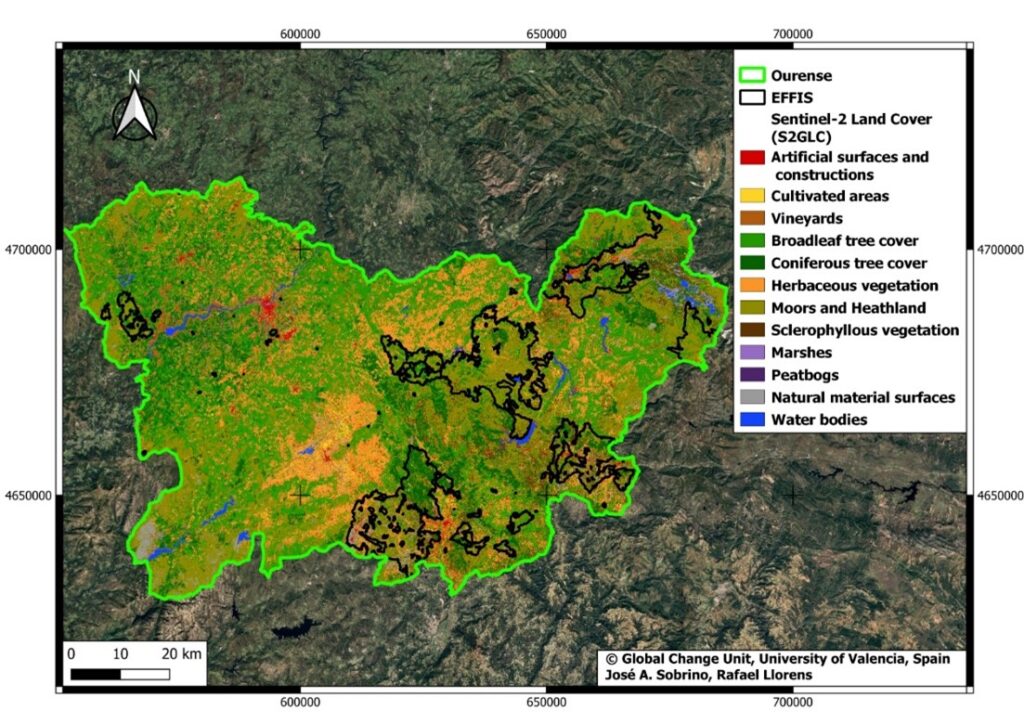
Figure 2. Burned area extracted by the European Forest Fire Information System (EFFIS) and the Land Cover (extracted by Sentinel-2 images) for the Ourense forest fires occurred in August, 2025.
2.2. Methodology
This study applies the methodology developed and validated by Sobrino et al. (2024), hereafter referred to as the Global Change Unit (UCG) approach, to estimate burned area and fire severity using the differenced Normalized Burn Ratio 2 (dNBR2) spectral index derived from Sentinel-2 imagery, as defined below:
B11 and B12 correspond to the Sentinel-2 SWIR1 (1610nm) and SWIR2 (2190 nm) channels. The overall error rate (average of omission and commission) was 5%, validated using severity plots obtained from different fires that ocurred between 2018 and 2023. For this purpose, Sentinel-2 Level-2A imagery with a spatial resolution of 20 m, atmospherically corrected with the Sen2Cor processor, was used. Based on the Scene Classification map (SCL), all pixels not corresponding to “Dark Area Pixels”, “Vegetation”, “Not vegetated”, or “Unclassified” were excluded (Richter and Schläpfer, 2005).
Fire severity was analysed on four dates: during and after the fire events (August 16, August 23, September 5, and September 25, 2025) and compared with field plots collected for the Outomuro forest fire (Ourense) on August 20, 21, 23, and 24, 2025. A pre-fire image acquired on August 1, 2025, was used for change detection. This reference image was selected based on minimal cloud cover and the absence of residual burn scars from previous fire events that could affect severity classification.
The field plot methodology assesses fire severity based on the percentage of burned vegetation (Ruiz-Gallardo et al., 2004; Ryan and Noste, 1985). Table 1 presents the classification of fire severity levels according to the percentage of burned vegetation.
Table 1. Percentage of burn vegetation and brief description (for each field fire severity class), based on Ruiz-Gallardo et al. (2004).
| Field fire severity class | Percentage of burn vegetation | Description |
| Null severity | Global vegetation ≈ 0 % | No effects on vegetation |
| Low | 0 % ≤ Global vegetation < 50 % 0 % ≤ Tree canopy < 30 % | – Shrub canopy specially affected by the fire – Some trees may be just scorched on the stem base or even intact |
| Moderate | 50 % ≤ Global vegetation < 90 % 30 % ≤ Tree canopy < 75 % | Most or all of the shrub canopy may have been killed |
| High | Global vegetation ≥ 90 % Tree canopy ≥ 75 % | Mostly killed vegetation |
3. Results and discussion
Figures 3, 4, 5, and 6 show the fire severity results for August 16 and 23 (during the active fire events) and for September 5 and 25, 2025 (after the fires were mostly contained). According to EFFIS data, the forest fires started in early August and were largely extinguished by early September
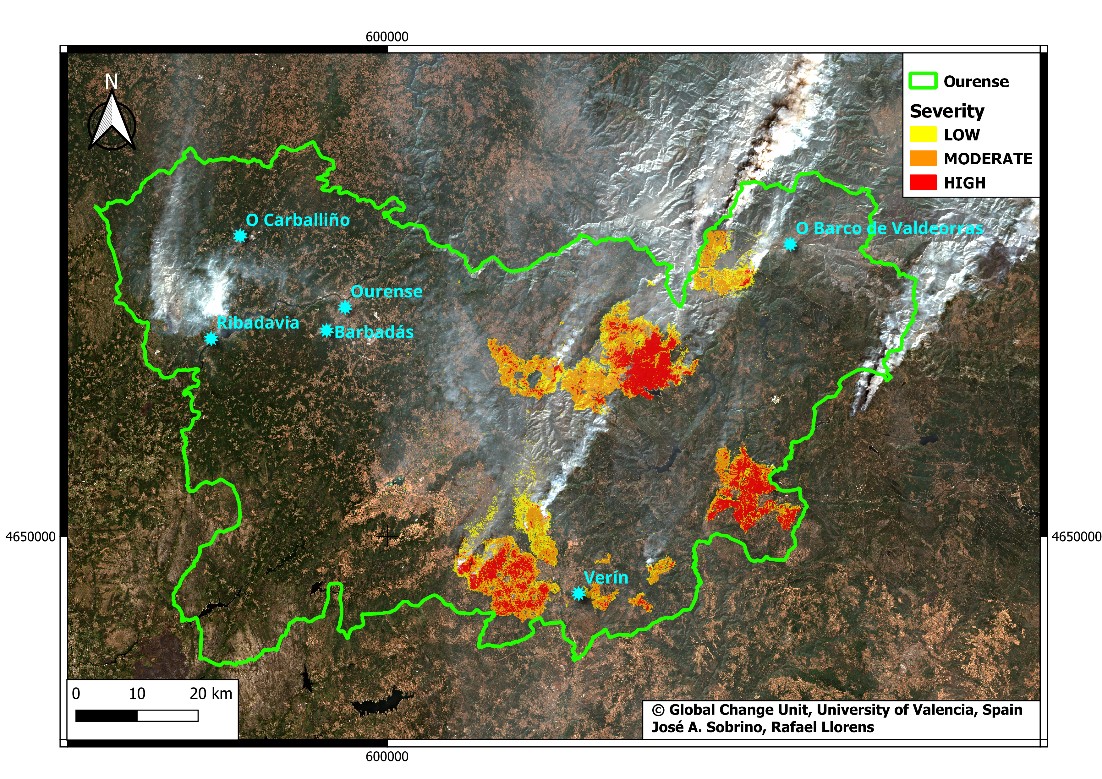
Figure 3. Fire severity map of the forest fires that occurred in Ourense on August 16, 2025.
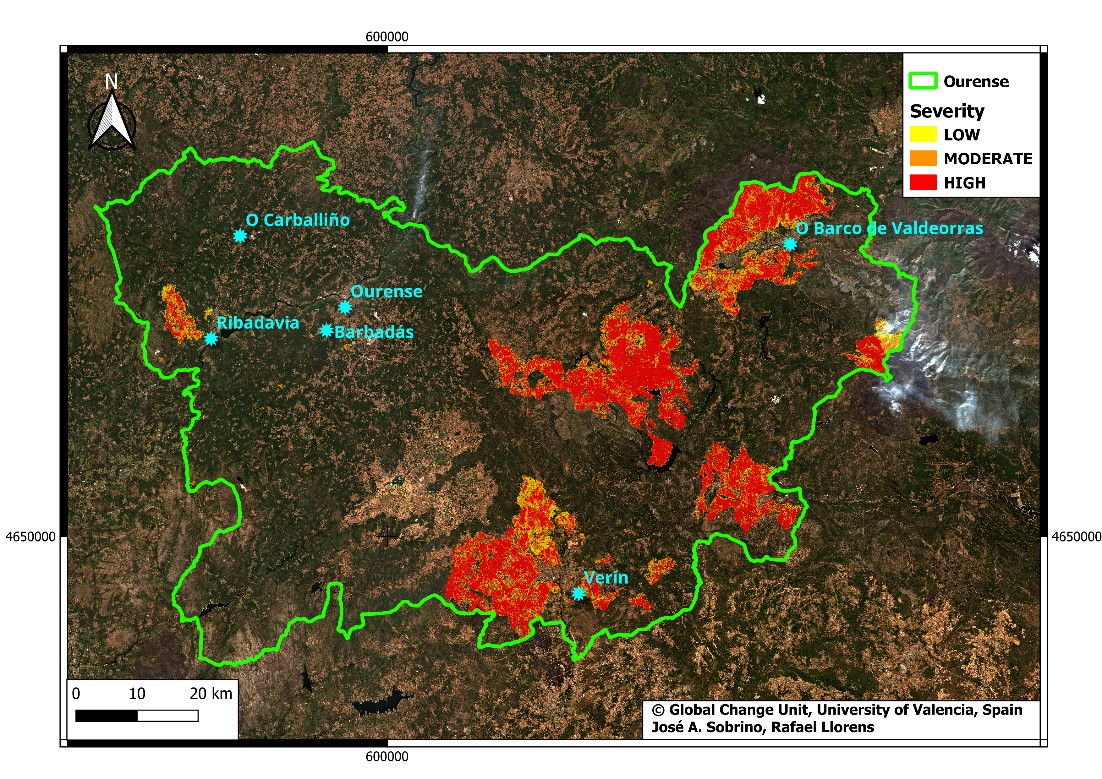
Figure 4. Fire severity map of the forest fires that occurred in Ourense on August 23, 2025.
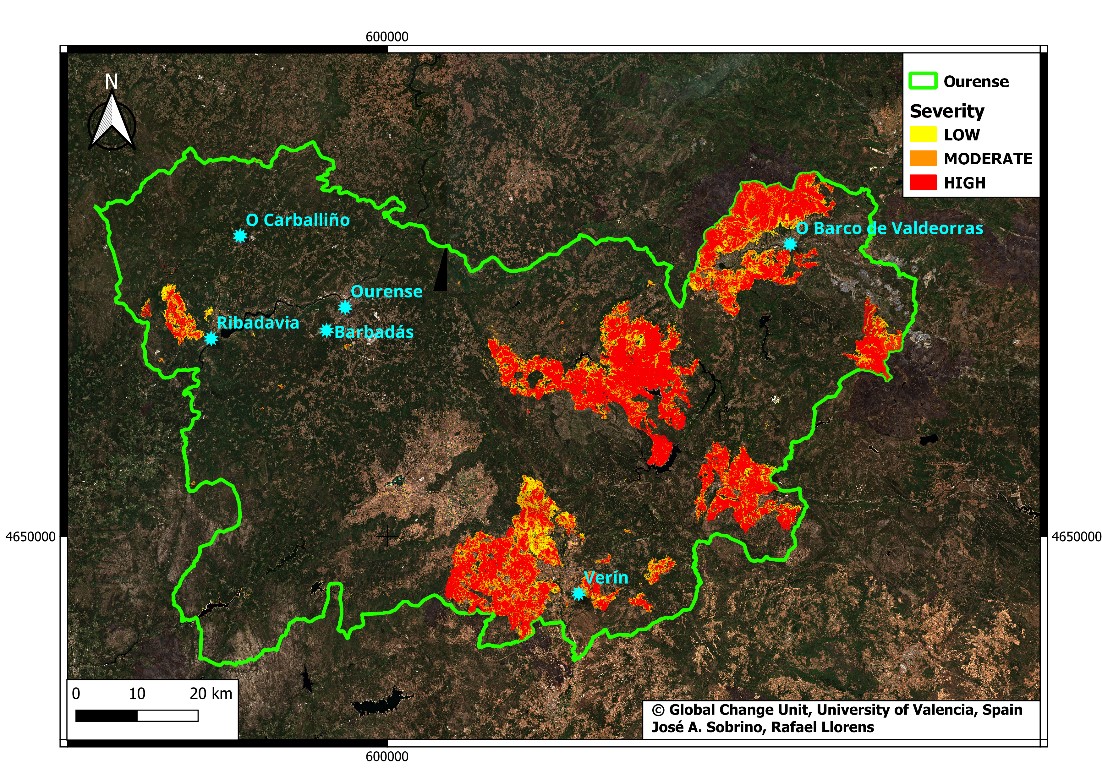
Figure 5. Fire severity map of the forest fires that occurred in Ourense on September 5, 2025.
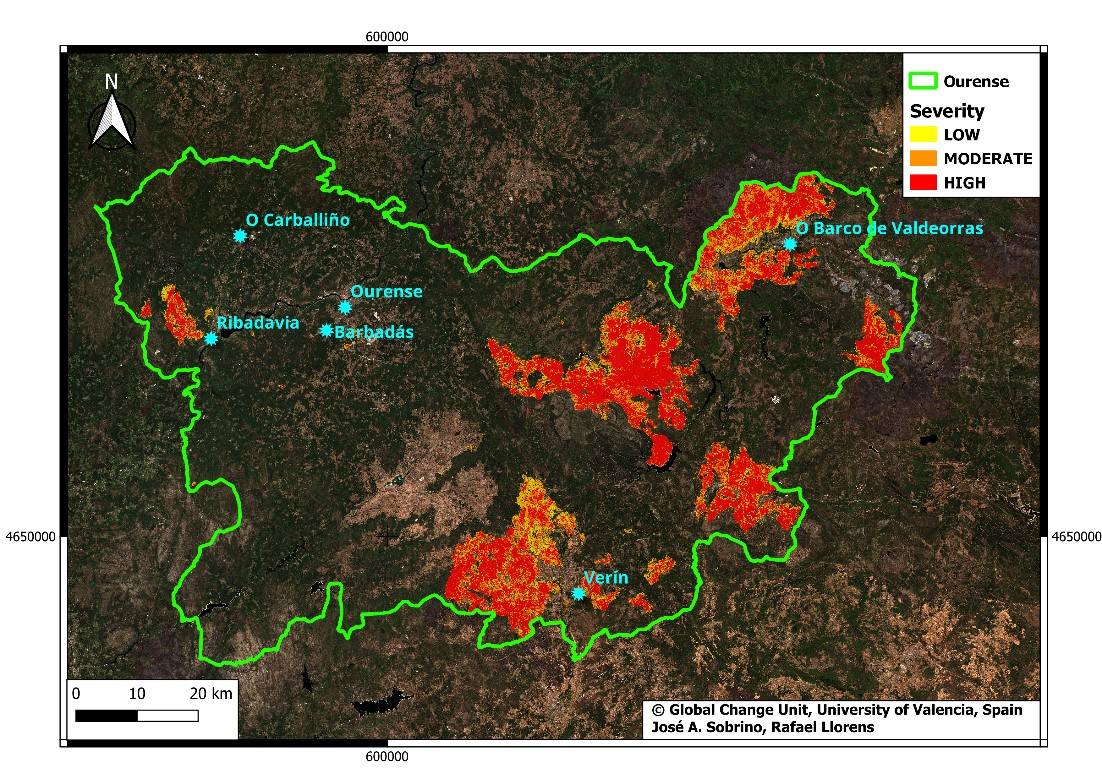
Figure 6. Fire severity map of the forest fires that occurred in Ourense on September 25, 2025.
Figure 7 presents a bar chart showing the burned area by severity class for each date, using the methodology proposed in this work (dNBR2 derived from Sentinel-2, see Equations 1 and 2) and the EFFIS burned area database (dNBR index derived from Sentinel-2 and MODIS). The results indicated that the burned surface increased over time, with moderate severity pixels progressively transitioning into high-severity ones. The observed increase in fire severity classification over time (approximately 1,000 ha of moderate severity on August 23 reclassified as high severity on September 5, 2025) can be explained by the gradual alteration of vegetation spectral properties. As plant tissues lose water content and cellular structure following combustion, reflectance in the near-infrared (NIR) region decreases markedly, while reflectance in the shortwave infrared (SWIR) region increases. This enhanced spectral contrast amplifies burn indices such as dNBR, resulting in the reclassification of areas from moderate to high severity (He, Shen and Anagnostou, 2023). Between September 5 and 25, however, the opposite trend was observed: high-severity areas decreased in favor of low and moderate severity, due to the natural regeneration processes occurring in the burned zones. The differences between the UCG and EFFIS methodologies were below 5% on most dates, indicating a high level of consistency between the two approaches. This strong agreement validates the reliability of the proposed UCG method. However, UCG advances beyond EFFIS by providing near-real-time severity estimates and a more adaptive treatment of vegetation variability. By applying specific spectral indices tailored to each severity level and vegetation density—unlike EFFIS, which relies on a single dNBR index—the UCG approach mitigates index saturation and improves the discrimination of burned area severity across diverse ecosystems
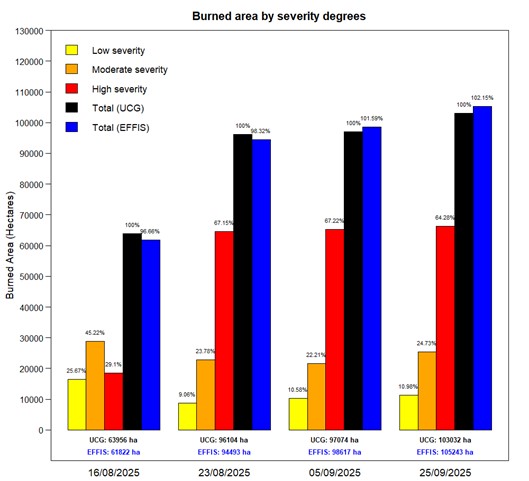
Figure 7. Burned area (hectares) by severity class for each date. 16 August 2025 — Low (16,419.16), Moderate (28,923.96), High (18,613.36), Total (63,957.28); 23 August 2025 — Low (8,711.20), Moderate (22,857.40), High (64,535.20), Total (96,103.80); 5 September 2025 — Low (10,267.60), Moderate (21,555.66), High (66,272.66), Total (98,095.92); 25 September 2025 — Low (11,317.07), Moderate (25,483.06), High (66,231.57), Total (103,031.70).
Figure 8 shows the validation areas, confirming an accuracy of 88%, despite the existing limitations. Field plots were collected under specific constraints, mainly due to terrain topography and meteorological conditions, during a forest fire close to Outomuro village (August, 2025). A total of 8 20 x 20 m plots were measured, four corresponding to low severity, one to moderate severity and three to high severity. In addition, since the field plots were visually selected following the protocol of Ruiz-Gallardo et al. (2004), only those clearly representing one of the four severity classes (unburned, low, moderate, or high) were considered valid (see Table 1).
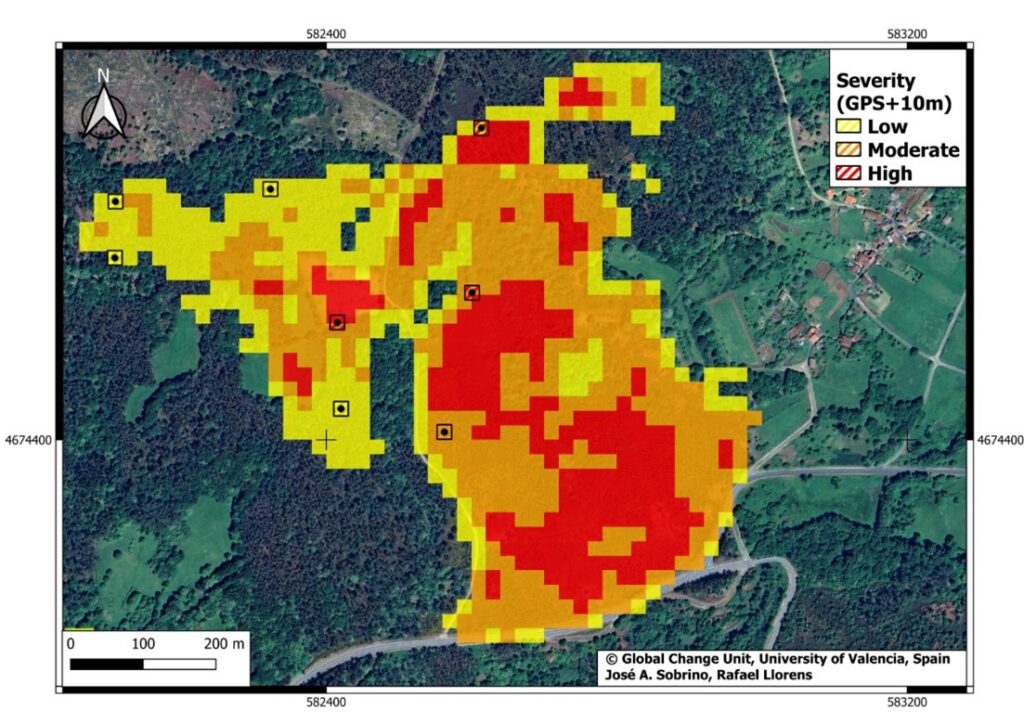
Figure 8. Field plots located on Outomuro (Ourense) in the area affected by the forest fire of August, 2025.
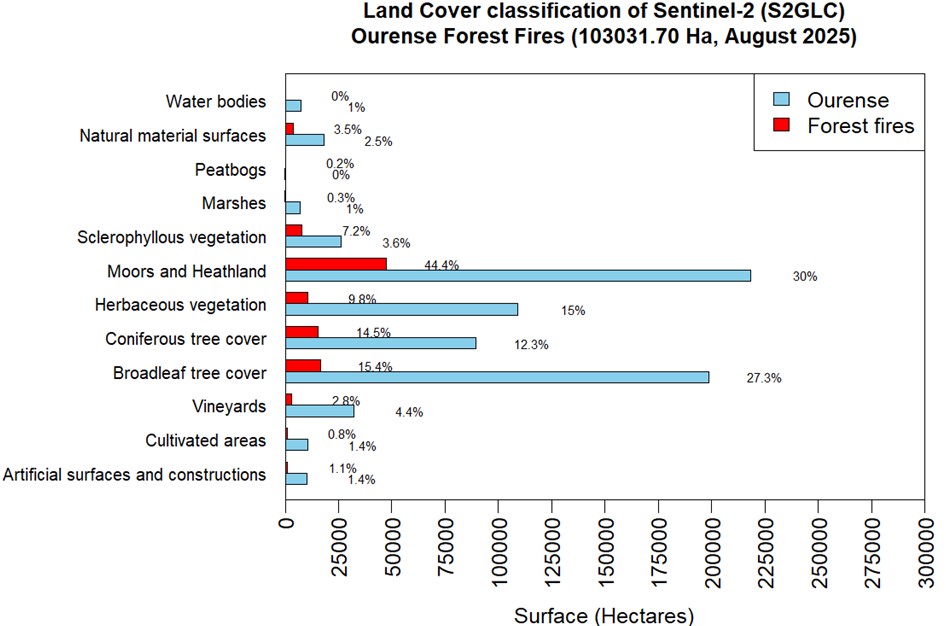
Figure 9 Comparison between the total surface area of Ourense and the burned areas, according to the Sentinel-2 land cover classification.
The two most prevalent land cover types in Ourense, Moors and Heathland and Broadleaf Forest, were also those most severely affected by the August 2025 forest fires, with Moors and Heathland showing the highest value of burned area (44.4% equivalent to 45746.10 ha). Post-fire analysis indicates that approximately 14.5% of the total area of Ourense was burned, corresponding to 4.4% of the forested area (Broadleaf and Coniferous tree cover).
4. Conclusions
This study demonstrates the effectiveness of Sentinel-2 imagery for assessing burned areas and fire severity during the forest fires that occurred in Ourense in August 2025. The multitemporal analysis enables monitoring of fire progression, revealing an increase in burned area from 63,957 ha on August 16 to 103,031.70 ha on September 25, 2025. The observed escalation in fire severity, particularly the transition from moderate to high severity, highlights the importance of post-fire temporal analysis, as spectral indices are sensitive to ongoing vegetation changes after combustion. Overall, approximately 14.5% of the total provincial area and 4.4% of the forested area were affected by fire. Field validation showed a classification accuracy of 88%, confirming the reliability of the satellite-based approach despite logistical and terrain constraints.
These findings confirm that high-resolution satellite imagery, combined with field validation, provides rapid, accurate, and spatially detailed information for post-fire assessment. From a management perspective, such information is critical for prioritising restoration actions, optimising resources allocation, and implementing targeted fire prevention measures in the most vulnerable areas.
Finally, the severity and extent of the 2025 Ourense forest fires highlight the growing exposure of Spanish forests to conditions that favour the spread of large wildfires. Prolonged periods of dryness, higher temperatures, and shifts in vegetation structure increase the susceptibility of forest ecosystems to ignition and rapid propagation once a fire starts. Although the causes of individual ignition events are diverse, the prevailing environmental conditions clearly determine their potential magnitude. This reinforces the importance of adaptive forest management, fuel control, and continuous monitoring through remote sensing technologies to mitigate the risk and impact of future fires.
Author Contribution statement
José A. Sobrino: Conceptualization, Methodology, Algorithms, Data Analysis, Writing, Funding acquisition. Rafael Llorens: Methodology, Algorithms, Software, Data extraction, Data Analysis, Writing.
Declaration of competing interest
The authors declare that they have no known competing financial interests or personal relationships that could have appeared to influence the work reported in this paper.
Acknowledgements
The authors thank the associated editor, and the reviewers for their thorough review and valuable comments. They also acknowledge the support of the EPyRIS project (European Union’s Interreg SUDOE programme, project number SOE2/P5/E0811), whose earlier funding made possible the development of the methodology applied in this study. Finally, the authors express their gratitude to Jaime Sousa Seara for guiding the team through the validation sites located in the municipality of Cartelle (Outomuro and Sabuz)
Funding
This work was funded by the Spanish Ministry of Science and Innovation through the project IPL Contribution to the Scientific Exploitation of the LSTM Mission (project number PID2023-150737OB-I00, IPL-HRTM), and by the project Indicadores medioambientales y fenómenos adversos en la Comunidad Valenciana usando datos de satélite, under the PROMETEO 2023 programme (CIPROM/2023/42).
References
Chuvieco, E., Riaño, D., Van Wagtendok, J., and Morsdof, F. (2003). Fuel loads and fuel type mapping. In Wildland fire danger estimation and mapping: The role of remote sensing data, pages 119–142. World Scientific. https://doi.org/10.1142/9789812791177_0005
Filipponi, F. (2018). BAIS2: Burned Area Index for Sentinel-2. Proceedings, 2(7), 364. https://doi.org/10.3390/ecrs-2-05177 (7)
He, K., Shen, X., and Anagnostou, E. N.: A global forest burn severity dataset from Landsat imagery (2003–2016), Earth Syst. Sci. Data, 16, 3061–3081, https://doi.org/10.5194/essd-16-3061-2024, 2024.Keeley, J. E. (2009). Fire intensity, fire severity and burn severity: a brief review and suggested usage. International Journal of Wildland Fire, 18(1):116–126. https://doi.org/10.1071/WF07049
Key, C. H., Benson, N. C., et al. (2006). Landscape assessment (LA). FIREMON: Fire effects monitoring and inventory system, 164:LA–1. Gen. Tech. Rep. RMRS-GTR-164-CD. Fort Collins, CO: U.S. Department of Agriculture, Forest Service, Rocky Mountain Research Station. p. LA-1-55
Malinowski, R., Lewiński, S., Rybicki, M., Gromny, E., Jenerowicz, M., Krupiński, M., Nowakowski, A., Wojtkowski, C., Krupiński, M., Krätzschmar, E., & Schauer, P. (2020). Automated Production of a Land Cover/Use Map of Europe Based on Sentinel-2 Imagery. Remote Sensing, 12(21), 3523. https://doi.org/10.3390/rs12213523
Miller, J. D. and Thode, A. E. (2007). Quantifying burn severity in a heterogeneous landscape with a relative version of the delta normalized burn ratio (dNBR). Remote Sensing of Environment, 109(1):66–80. https://doi.org/10.1016/j.rse.2006.12.006
Parks, S. A., Dillon, G. K., & Miller, C. (2014). A New Metric for Quantifying Burn Severity: The Relativized Burn Ratio. Remote Sensing, 6(3), 1827-1844. https://doi.org/10.3390/rs6031827
Pausas, J. G. and Keeley, J. E. (2019). Wildfires as an ecosystem service. Frontiers in Ecology and the Environment, 17(5):289–295. https://doi.org/10.1002/fee.2044
Richter, R., and D. Schl¨apfer, ”Atmospheric / topographic correction for satellite imagery: ATCOR-2/3 User Guide”, DLR IB 565-01/21, Wessling, Germany (2021).
Ruiz-Gallardo, J. R., Castaño, S., and Calera, A. (2004). Application of remote sensing and GIS to locate priority intervention areas after wildland fires in Mediterranean systems: a case study from south-eastern Spain. International Journal of Wildland Fire, 13(3):241–252. https://doi.org/10.1071/WF02057
Ryan, K. C. and Noste, N. V. (1985). Evaluating prescribed fires. Lotan, James E.; Kilgore, Bruce M.; Fischer, William C, pages 15–18.
Sobrino, J. A., Llorens, R., Fernández, C., Fernández-Alonso, J. M., and Vega, J. A. (2019). Relationship between soil burn severity in forest fires measured in situ and through spectral indices of remote detection. Forests, 10(5):457. https://doi.org/10.3390/f10050457
Sobrino, J. A., Llorens, R., Fernández, C., Fernández-Alonso, J. M., & Vega, J. A. (2024). Methodology for burned areas delimitation and fire severity assessment using Sentinel-2 data. A case study of forest fires occurred in Spain between 2018 and 2023. Recent Advances in Remote Sensing, 2, 1-13. https://doi.org/10.62880/rars240002
Trigg, S. and Flasse, S. (2001). An evaluation of different bi-spectral spaces for discriminating burned shrub-savannah. International Journal of Remote Sensing, 22(13):2641–2647. https://doi.org/10.1080/01431160110053185
Publisher’s Note
The statements, opinions, and data contained in all publications are solely those of the individual author(s) and contributor(s) and not of Recent Advances S.L. and/or the editor(s). Recent Advances S. L. and/or the editor(s) disclaim responsibility for any injury to people or property resulting from any ideas, methods, instructions, or products referred to in the content.