



Tracking environmental response of Spanish productivity over 19 years
B. Martínez

*, S. Sánchez-Ruiz
, M. Campos-Taberner
, A. Jiménez-Guisado
, F. J. García-Haro
, M. A. Gilabert
* Author to whom correspondence should be addressed.

Abstract
The main objective of this study is to detect and quantify monotonic trends in a time series of gross primary production (GPP) in peninsular Spain over 19 years, from 2004 to 2022. Daily GPP values are derived at 1-km spatial resolution from an optimized methodology adapted to the Spanish inland territory to obtain a GPP climate data record. These time series can be analyzed by means of the non-linear Bκ-embeddings (NLE) method, which is based on smooth mathematical structures depending on a continuous real parameter κ, with values ranging between zero (original time series) and infinity (trend component, characterizing the interannual variation). The continuous variation of κ is crucial for the decomposition of the time series into different temporal components, offering a flexibility that other methods do not provide. The magnitude and direction of trend (increasing or decreasing slope of interannual variation computed from the GPP time series) are analyzed in terms of precipitation variations throughout the 2004-2022 period. For that purpose, daily images of precipitation (including the SPI) at 1-km spatial resolution for the same period are obtained from the Spanish Meteorological Agency (www.aemet.es). Statically significant ecosystems changes are enhanced, identified and explained in terms of the aforementioned relationships between GPP and meteorological variables, centering the focus on subtle changes as those due to degradation processes.Keywords
daily GPP, monotonic trends, non-linear embeddings1. Introduction
A full description of the carbon cycle requires detailed information on spatiotemporal patterns of surface–atmosphere carbon fluxes. One of the main carbon fluxes characterizing terrestrial ecosystems and biodiversity is the gross primary production (GPP), i.e., the amount of carbon absorbed by vegetation to perform photosynthesis, since it establishes the main carbon and energy inputs to ecosystems for producing food, wood, and fiber (Xiao et al., 2019). Consequently, ecosystem dynamics can be characterized by analyzing GPP time series, which show non-stationary behavior due to short-term, seasonal and long-term variations.
This study focusses in long-term variations, which use to be linked to climate variability and, in some cases, are found in areas affected by land degradation processes. Vegetation in these areas is sparse; the subtle changes require a precise methodology to be detected and quantified and the detection of trends ensuring statistical significance is rather difficult due to the associated uncertainties. Degradation processes are found in several countries on the Mediterranean Basin, in particular, Spain. Mainland Spain territory is analyzed by means of daily GPP time series at 1-km spatial resolution to detect long-term vegetation changes. The non-linear Bκ-embeddings (NLE) method is used to analyse the time series. It is based on smooth mathematical structures depending on a continuous real parameter κ, with values ranging between zero (original time series) and infinity (trend component, characterizing the interannual variation) (García-Morales, 2017). The magnitude and direction of trend (increasing or decreasing slope of interannual variation) are analyzed in terms of precipitation variations throughout the 2004-2022 period.
2. Materials
2.1. Daily GPP time series
The procedure to obtain the daily GPP (gm−2d−1) images is described in Martínez et al. (2022) and corresponds to:
GPP = PAR fAPAR ϵmax Cws Tmin (1)
The PAR (MJ m−2 d−1) accounts for the photosynthetically active radiation (0.4–0.7 μm). It is computed as 46 % of the daily solar irradiance, which was given by the MSG DIDSSF product (LSA-203) reprocessed and available from 2004 up to the present at https://landsaf.ipma.pt/. This product was very satisfactorily validated in the study area and is used as the input of the MSG/SEVIRI GPP product LSA-411.
The daily fAPAR (fraction of absorbed PAR) at 1-km spatial resolution is obtained by applying the algorithm proposed by Roujean and Breon (1995) to MODIS products MCD43A1 and MCD43A2. This algorithm is used to derive the SEVIRI/MSG fAPAR product (LSA-425).
ϵmax (g MJ−1) is the ecosystem light use efficiency under optimal conditions and depends on the vegetation type. An optimized vegetation map for the study area is used to assign the ϵmax value to each pixel according to the literature (Martínez et al., 2022).
Cws is a water stress coefficient that is calculated as a linear relationship with the water balance between actual and potential evapotranspiration (AET and PET, respectively). In this case as AET is not available, precipitation is considered when AET is lower than PET (Martínez et al., 2022). PET (mm m−2d−1) is obtained, according to (Jensen and Haise, 1965) parameterization, from the daily global irradiation from the LSA-203 product, and the daily air temperature.
Tmin refers to the Tmin_scalar used in the MOD17 product (Running and Zhao, 2021). It is a linear ramp function of minimum air temperature that reduces ϵmax accounting for low temperatures, depending also on the vegetation type.
2.2. Precipitation data
Daily precipitation data are provided by the Spanish Meteorological Agency (http://www.aemet.es) for the 2004–2022 period. The daily images at 5-km spatial resolution are resampled at 1-km resolution. SPI images are computed from them. The SPI quantifies precipitation anomalies by transforming observed precipitation into a gamma distribution for a specific period (World Meteorological Organization (WMO), 2012). In this study, the 12-month SPI time series over the period 2004–2022 are computed to enhance the identification and understanding of vegetation changes.
3. Methods
Non-linear Bκ-embeddings (NLE) are smooth mathematical structures that connect objects with similar or different dimensions (García-Morales, 2017). The dimension reduction involves a mixed convolution of discrete and continuous time variables. The continuous variation of a real parameter κ > 0 allows constructing the elements of the embedding. The objects connected by the embedding act as fixed points of the latter in the limits κ → 0 and κ → ∞. NLE have proved to be very useful in connecting vector spaces of different dimensions (García-Morales, 2020).
NLE have several key features that make them worthwhile for the analysis of time series. One of them is that this technique allows revealing hidden structures of different scales immersed in the time series (García-Morales, 2017, 2020). Another key feature is that the objects connected by the embedding can be recovered not only in the limits κ → 0 and κ → ∞ but also for a continuous range of κ values. The value of the scale parameter κ changes with the temporal resolution of the time series since it determines the number of measurements in a specific time interval. The effectiveness of the NLE method was previously analyzed using 16-day MODIS NDVI TS at 1-km spatial resolution in Spain (Martínez et al., 2025). It detected subtle changes with lower uncertainty than the multi resolution analysis based on the wavelet transform, MRA-WT, which has been extensively used over the past few decades in several fields such as remote sensing, finance, medicine, etc., (Martínez and Gilabert, 2009; Rhif et al., 2022).
Temporal analysis at local and regional level are carried out. First, the temporal dynamics of GPP using the NLE procedure is performed on the original GPP time series to derive the interannual component (κ = 23). Second, the trend, in terms of magnitude and direction, of the interannual component is obtained through the combination of the Mann–Kendall test and the Theil–Sen slope estimator, QGPP, at a significant level of 0.05 (p−value). Third, the 12-month SPI (SPI12) is considered as the interannual variation of precipitation. Both the Mann-Kendall test and Theil-Sen slope are used to derive the precipitation trend QSPI12. Here, a relaxed significance threshold of 0.3 is adopted to increase the number of pixels comparable to GPP trend values.
4. Results
4.1. Local assessment
Eight sites corresponding to different ecosystems are selected (Table 1) and shown in Figure 1 over a hybrid land cover map from Pérez-Hoyos et al. (2012). To minimize the limitations imposed by the coarse spatial resolution of MODIS, the local analysis has been performed at homogeneous sites. The sites have been chosen to capture differences in plant structure, and consequently in their radiative regime, and are preferably located in the following areas: (i) natural parks, such as La Albufera in Valencia (site #6) and Sierra de Cazorla, Segura y las Villas in Jaén (site #2); (ii) forest areas such as Selva de Irati in Pamplona (site 3); and (iii) degradation vulnerable areas from NATURA 2000 network (https://natura2000.eea.europa.eu/), such as sites #5 and #8. The results of the application of NLE to the GPP time series at local scale are shown in Figure 2.
The sites #7 and #8, which exhibit negative trends, correspond to areas of natural vegetation located in semi-arid regions (Alicante and Almeria regions) rendering them particularly vulnerable to desertification. Soil erosion, worsened by overgrazing, deforestation, and poor land management, is one of the primary consequences of land degradation in this area. The area uses to be affected by periodic droughts that exacerbate desertification risks, such as the dry period in 2005 (https://www.aemet.es/es/serviciosclimaticos/vigilancia_clima/).
Table 1. Selected sites for different land cover types. Codes: EBF (evergreen broadleaved
forest), ENF (evergreen needle-leaved forest), DBF (deciduous broadleaved forest),
GRA (grassland), ICRO (irrigated crop), SHR (shrubland), and SPV (sparse
vegetation).
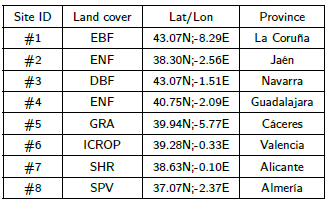
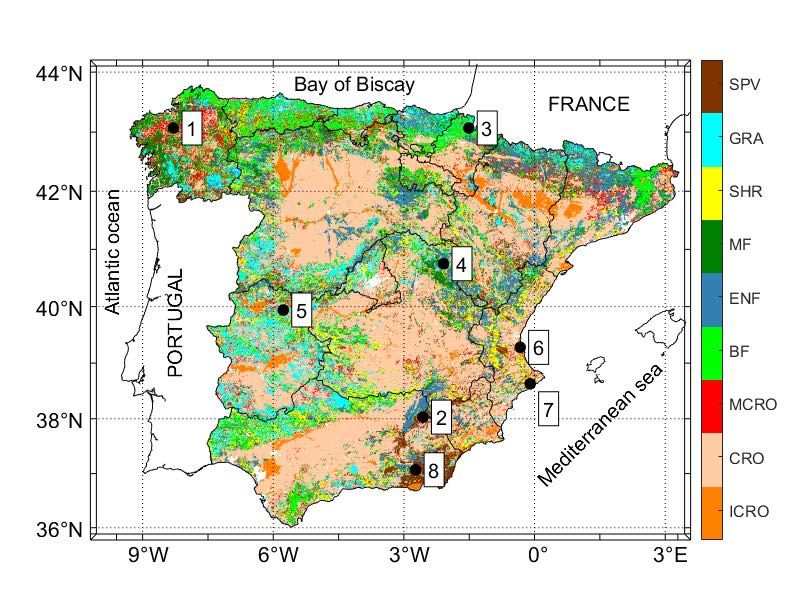
Fig.1. Location of the selected sites over a land cover map. (Codes: see Table 1).
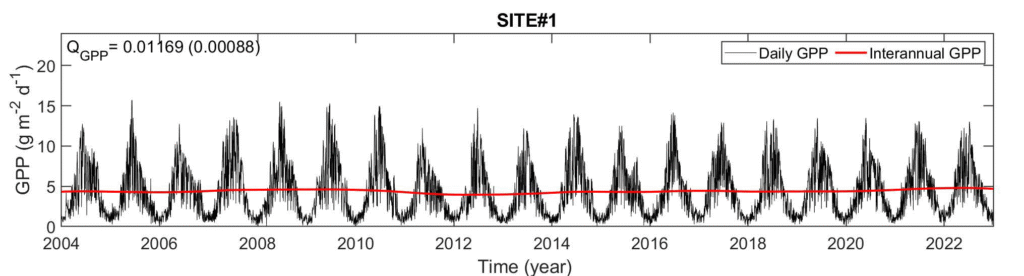
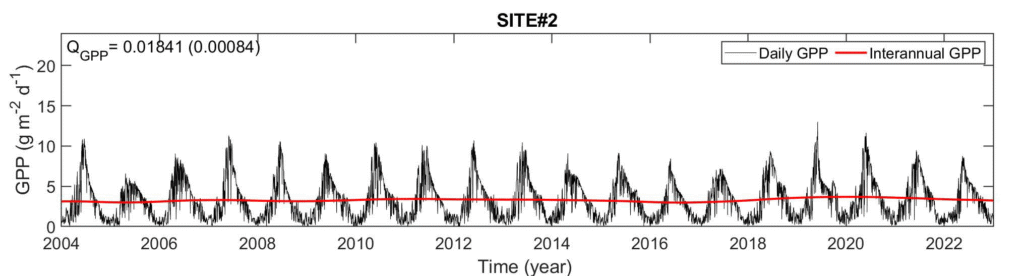
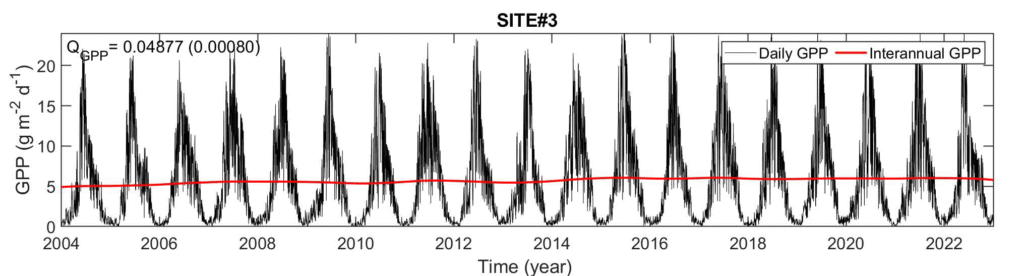
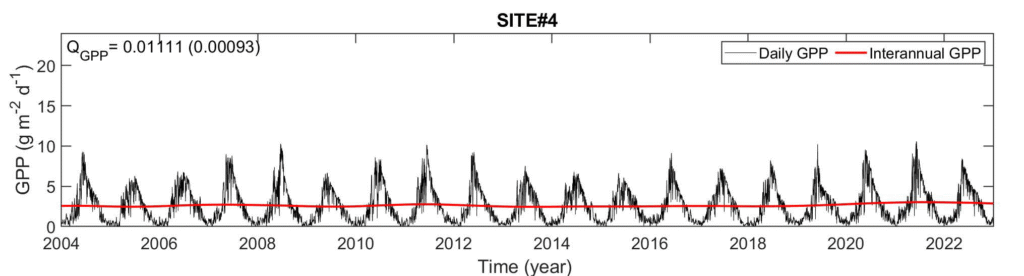
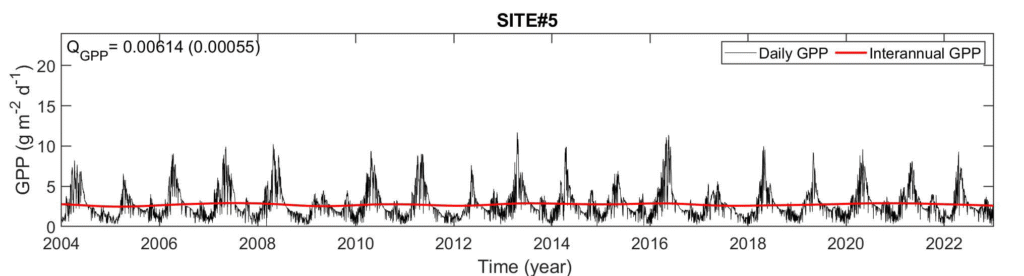
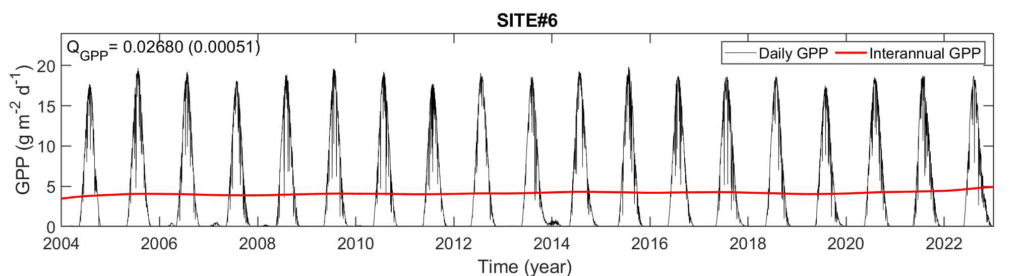
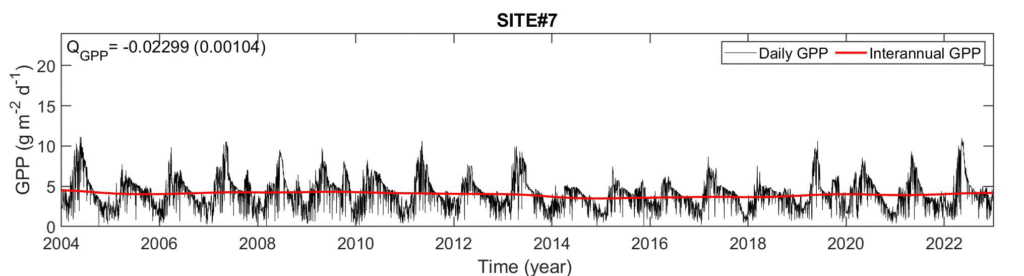
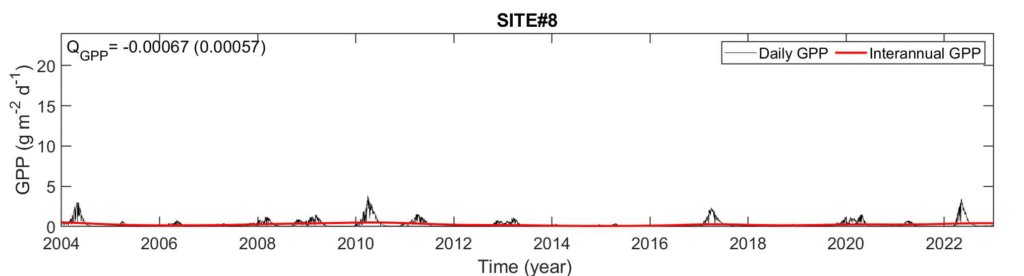
Figure 2: Original time series (black line) and inter-annual component (red line)
obtained from the NLE method.
4.2. Regional assessment
Figure 3 shows the results of the application of NLE at regional level to map significant changes: the magnitude of the change (top) (i.e., the Theil-Sen slope of the interannual component), and its direction and significance (bottom). A non-significant value of the Mann–Kendall test (0 value) means the null hypothesis (H0) (no trend exists) may not be
rejected, whereas a significant test value (1 value) assumes H0 is rejected, and a trend is considered. H0 is rejected at p < 0.1 significance level for the daily GPP time series. Annually, 85.4 % of the area shows a statistically significant greening, with dominance in northern Spain, the eastern and northwest Pyrenees and in the Ebro basin. These spatial patterns can be linked to land cover changes and processes, such as transformation to
irrigated land, the conversion from shrubs to pastures or a revegetation process in mountain areas affected by land abandonment (Vicente-Serrano et al., 2020). In contrast, only a few browning areas (12.9 % showing statistically significant negative changes) are detected, mainly located in central, southern and eastern Spain.
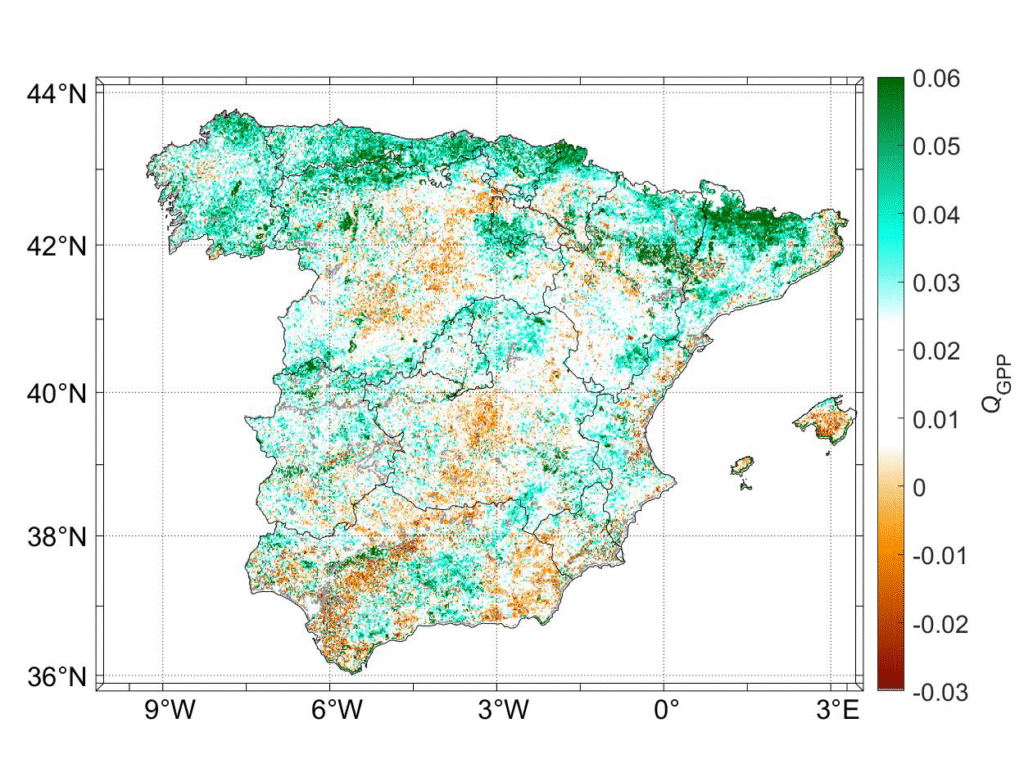
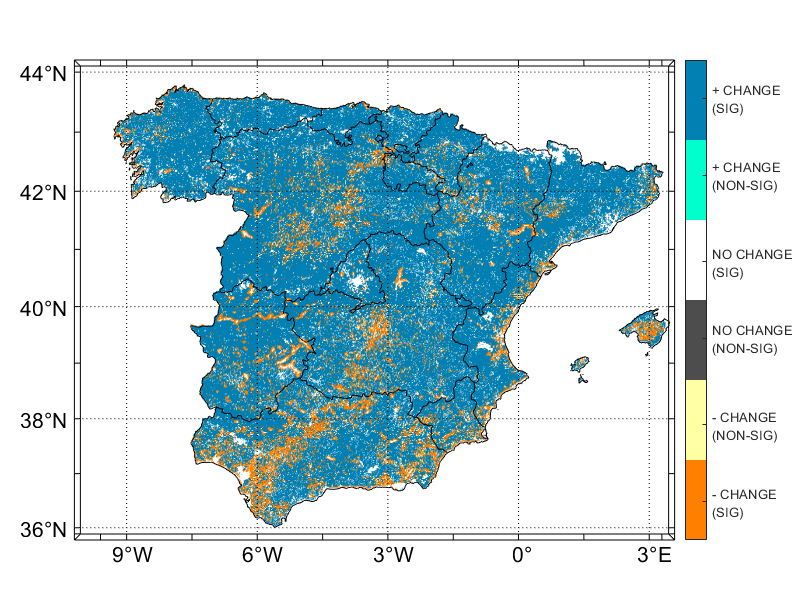
Figure 3: Theil-Sen slope (top) and Mann-Kendall significance test (bottom) for the
inter-annual component obtained when the NLE is applied to daily GPP time series.
The spatial distribution and magnitude of trends in this study are consistent with the findings of previous research (Martínez and Gilabert, 2009; Vicente-Serrano et al., 2020; Martínez et al., 2022; Gutiérrez-Hernández and García, 2024), which report a general enhancement of vegetation activity and adaptation to climate change. The few areas
affected by productivity loss are potentially driven by consequences of land use intensification and extensification. Droughts, loss of soil organic matter, soil erosion, intensification of irrigated areas in marginal regions, overexploitation of groundwater resources and salinization of agricultural fields are examples of land use- and land cover-related processes that can ultimately lead to land degradation and desertification (Cherlet et al., 2018; Martínez et al., 2022). Particularly, some areas with negative trends
have been affected by forest fires, which contribute to land degradation by causing soil erosion, nutrient loss, alterations in soil properties, and reduced vegetation cover, ultimately leading to a loss of ecosystem functionality.
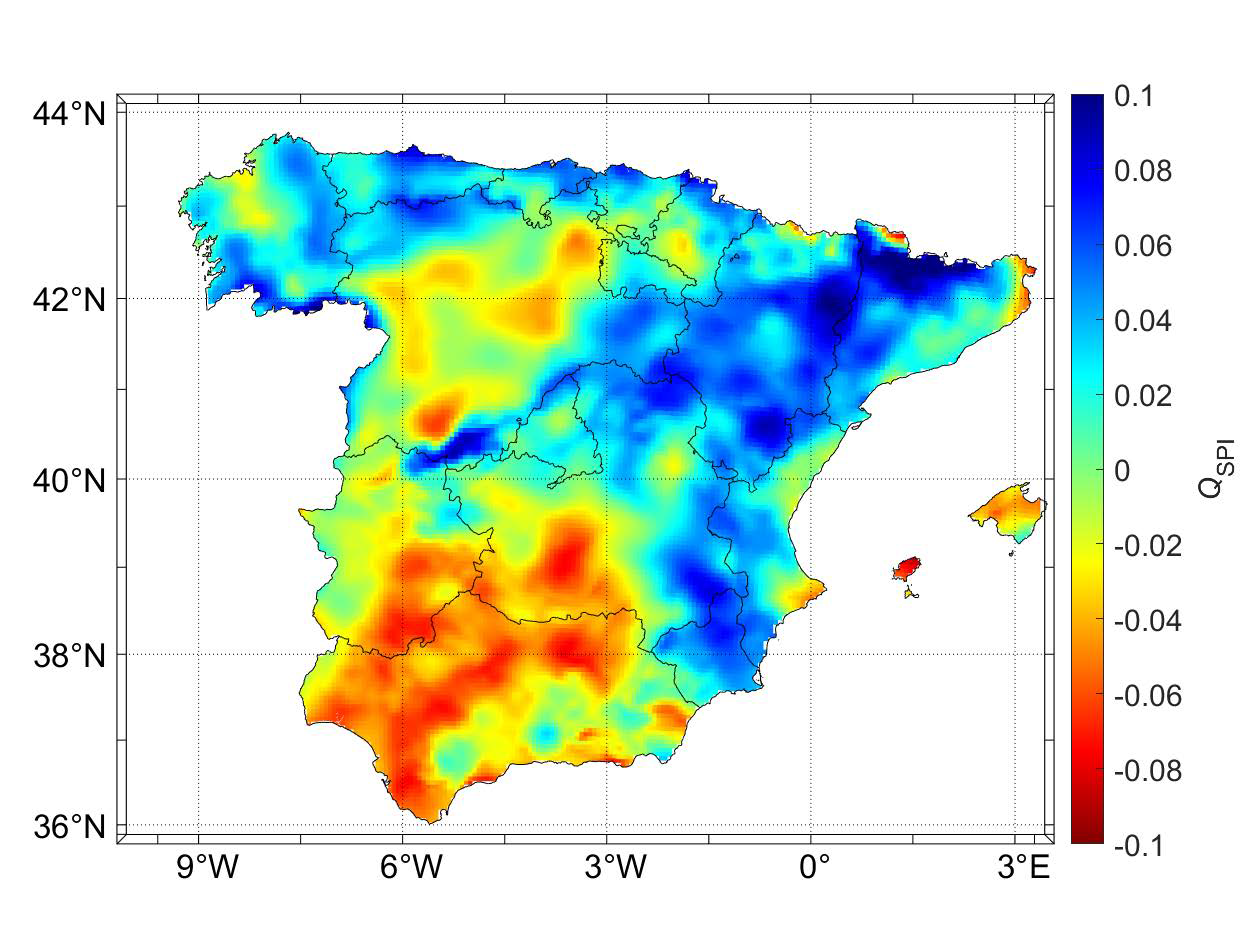
On the other hand, the Theil-Sen slope, computed from monthly SPI12 time series, characterizes the direction and statistical significance of the monotonic trend in the precipitation time series (Figure 4). The interannual GPP trends shown in Figure 3 can be mainly attributed to variations of precipitation during the same period. Exceptions are found in areas also affected by human activity (land abandonment) or disturbance events, such as forest fires (the Valencia region in eastern Spain).
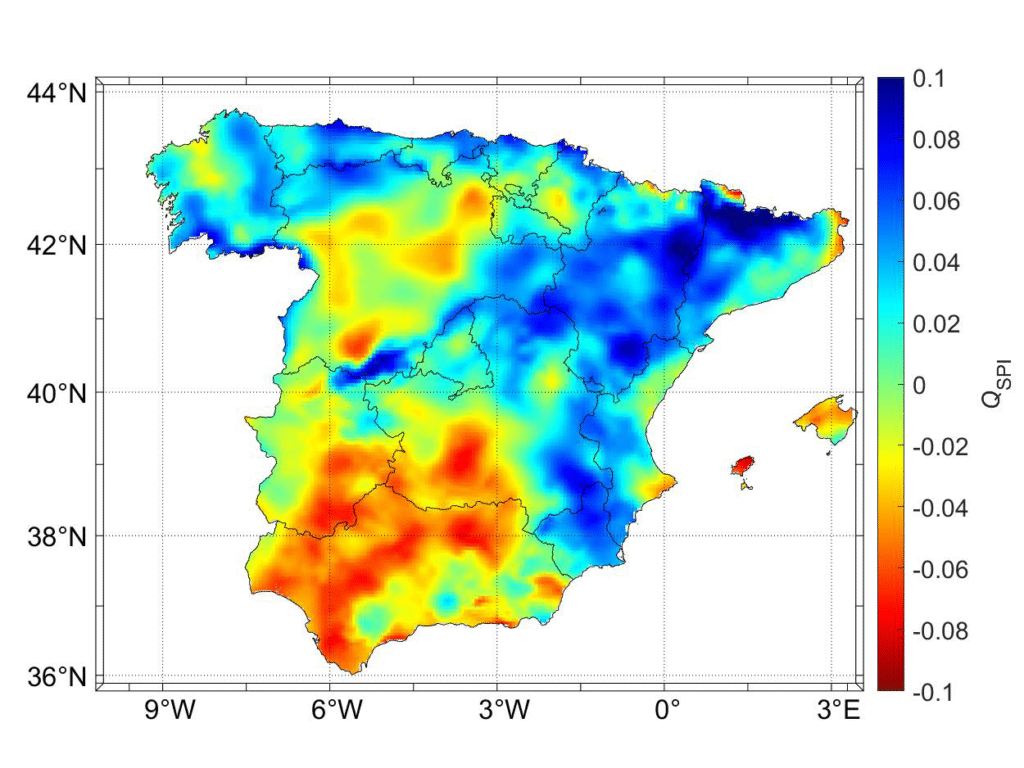
Figure 4: Theil-Sen slope for the monthly SPI12 time series. The p−value condition
is relaxed to 0.3 in order to have a larger number of pixels to be compared with the
GPP trend values in Figure 3.
5. Conclusions
The methodology used to infer subtle long-term vegetation changes from daily GPP at 1-km spatial resolution series over Peninsular Spain is based on the non-linear Bk−embeding (NLE) method. One of the advantages of NLE is that it depends on a kappa parameter; by changing κ we can obtain different temporal components such as the interannual component. It has made it possible to map significant interannual trends, which have been related to precipitation variability.
A clear agreement between GPP and precipitation patterns was observed, particularly in southeastern Spain, eastern Mediterranean coastland, and central Spain. Evidence of high vulnerability is confirmed in southeastern Spain areas where land degradation areas are detected. These changes are mainly attributed to variations of precipitation as exception of local areas, which may be affected by human activity or hazards events, such as forest fires.
It is important to note that it is difficult to directly compare our derived result with other published results in Spain since the interannual trend is highly dependent on the length, temporal resolution and starting point of the time series. The same area may show positive interannual trends if the time series begins just after a forest fire, or negative trends if it ends with a forest fire.
Author Contributions
B. Martínez: Conceptualization, Methodology, Algorithms, Data extraction and analysis, Software, Writing. S. Sánchez-Ruiz: Methodology, Data extraction and analysis. M. Campos-Taberner: Methodology, Data extraction and analysis. & editing. A. Jiménez-Guisado: Data Analysis. & editing. F. J. García-Haro: Data Analysis. M. A. Gilabert: Conceptualization, Methodology, Algorithms, Data Analysis, Writing, Funding acquisition.
Declaration of competing interest
The authors declare that they have no known competing financial interests or personal relationships that could have appeared to influence the work reported in this paper.
Acknowledgements
This research was supported by the LSA SAF (EUMETSAT) and ECCE EO project (PID2020-118036RB-I00).
Funding
Grant PID2020-118036RB-I00 funded by the MCIN/ AEI/10.13039/501100011033
References
Cherlet, M., Hutchinson, C., Reynolds, J., Hill, J., Sommer, S., and von Maltitz, G., editors (2018). World Atlas of Desertification. Publication Office of the European Union, Luxembourg.
García-Morales, V. (2017). Nonlinear embeddings: Applications to analysis, fractals and polynomial root finding. Chaos, Solitons & Fractals, 99:312.
García-Morales, V. (2020). Unifying vectors and matrices of different dimensions through nonlinear embeddings. Journal of Physics: Complexity, 1:025008.
Gutiérrez-Hernández, O. and García, L. V. (2024). Trends in vegetationseasonality in the iberian peninsula: Spatiotemporal analysis using avhrr-ndvi data (1982–2023). Sustainability, 16:9389.
Jensen, M. E. and Haise, H. R. (1965). Estimating evapotranspiration from solar radiation. Journal of the Irrigation and Drainage Division, 89:15–41.
Martínez, B., García-Morales, V., Manzanares, J. A., and Gilabert, M. A. (2025). The nonlinear embeddings method for long-term vegetation dynamics. ISPRS Journal of Photogrammetry and Remote Sensing. in revision.
Martínez, B. and Gilabert, M. A. (2009). Vegetation dynamics from ndvi time series analysis using the wavelet transform. Remote Sensing of Environment, 113(9):1823–1842.
Martínez, B., Sánchez-Ruiz, S., Campos-Taberner, M., García-Haro, F. J., and Gilabert, M. A. (2022). Exploring ecosystem functioning in Spain with gross and net primary production time series. Remote Sensing,
14:1310.
Martínez-Valderrama, J., del Barrio, G., Sanjuán, M. E., Guirado, E., and Maestre, F. T. (2022). Desertification in spain: A sound diagnosis without solution and new scenarios. Land, 11:272.
Pérez-Hoyos, A., García-Haro, F. J., and San-Miguel-Ayanz, J. (2012). A methodology to generate a synergetic land-cover map by fusion of different land-cover products. International Journal of Applied Earth Observation and Geoinformation, 19:72–87.
Rhif, M., Ben Abbes, A., Martínez, B., Farah, I. R., and Gilabert, M. A. (2022). Optimal selection of wavelet transform parameters for spatio-temporal analysis based on non-stationary ndvi modis time series in mediterranean region. ISPRS Journal of Photogrammetry and Remote Sensing, 193:216–233.
Roujean, J.-L. and Breon, F.-M. (1995). Estimating par absorbed by vegetation from bidirectional reflectance measurements. Remote Sensing of Environment, 51:373–384.
Running, S. and Zhao, M. (2021). User’s guide daily gpp and annual npp (mod17a2h/a3h) and year-end gapfilled (mod17a2hgf/a3hgf) products nasa earth observing system modis land algorithm (for collection 6.1). Technical report, University of Montana, Missoula, MT, USA.
Vicente-Serrano, S. M., Martín-Hernández, N., Reig, F., Azorin-Molina, C., Zabalza, J., Beguería, S., Domínguez-Castro, F., El Kenawy, A., Peña-Gallardo, M., Noguera, I., and García, M. (2020). Vegetation greening in Spain detected from long term data (1981–2015). International Journal of Remote Sensing, 41(5):1709–1740.
World Meteorological Organization (WMO) (2012). Standardized Precipitation Index User Guide. WMO, Geneva, Switzerland.
Xiao, J., Chevallier, F., Gomez, C., Guanter, L., Hicke, J. A., Huete, A. R., Ichii, K., Ni, W., Pang, Y., Rahman, A. F., et al. (2019). Remote sensing of the terrestrial carbon cycle: A review of advances over 50 years. Remote Sensing of Environment, 233:111383.
Publisher’s Note
The statements, opinions, and data contained in all publications are solely those of the individual author(s) and contributor(s) and not of Recent Advances S.L. and/or the editor(s). Recent Advances S. L. and/or the editor(s) disclaim responsibility for any injury to people or property resulting from any ideas, methods, instructions, or products referred to in the content