



Earth Surface Temperature Trends from MODIS LST and SST Products (2003–2023): A Comparison of versions 6 and 6.1
José Antonio Sobrino

, Letian Wei
,Yves Julien
, Susana García-Monteiro

Abstract
Global warming is a clearly observable phenomenon, supported by decades of ground-based measurements. Owing to its ability to support large-scale and long-term studies, satellite imagery has been extensively used for the quantitative analysis of surface parameters. In this study, Earth Surface Temperature (EST) from 2003 to 2023 was derived using MODIS Land Surface Temperature (LST) and Sea Surface Temperature (SST) products, by applying an area-weighted average method. Additionally, the MOD11C2/MYD11C2 Version 061 (V6.1) products, an upgraded release of MODIS Version 006 (V6), were incorporated into the analysis, as the previous version ceased distribution in November 2022. Results show that both LST and EST values from V6.1 are slightly higher than those from V6, particularly from 2016 to 2023. However, the overall EST trends from both versions are consistent: 0.021 ± 0.004°C/yr for V6 and 0.025 ± 0.004°C/yr for V6.1, closely aligning with the NOAA’s National Climatic Data Center (NOAA-NCDC) temperature anomaly trend of 0.024 ± 0.003°C/yr. Regionally, the Northern Hemisphere shows faster warming than the Southern Hemisphere, and land are warming more rapidly than oceans. Notably, the Northern Temperate Zone (66.5°N–23.5°N) exhibits the highest increase in EST. Finally, linear regression and Sen’s slope methods were applied to generate trend maps of surface temperature, while the Mann–Kendall test was used to assess the significance level of these trends.Keywords
Land Surface Temperature (LST), Sea Surface Temperature (SST), MODIS, NOAA anomalies, Earth Surface Temperature (EST)1. Introduction
Long-term trends of surface temperature serve as a key indicator of climate change. Admittedly, Thermal infrared (TIR) remote sensing data has been widely used for earth observation. Among them, MODIS and Landsat are the most popular TIR datasets (Reiners et al., 2023), however, focused on different application scales. MODIS is primarily used for large-scale, such as global (Sobrino et al., 2020a; Sobrino et al., 2020b) and continental (NourEldeen et al., 2020) observations with high temporal resolution, while Landsat is mainly used for regional studies with high spatial resolution (Nill et al., 2019; Najafzadeh et al., 2021).
So far, only a few studies were conducted on long-term global surface temperature. Based on previous work (Sobrino et al., 2020a; Sobrino et al., 2020b), this study extends the research period from 2019 to 2023. The MODIS onboard AQUA and TERRA satellites feature a short revisit period and provide global-scale observations of the Earth. Combined with its supporting mature algorithms for temperature retrieval, therefore, MODIS temperature products have been widely applied in large-scale research (Sobrino and Julien, 2013). However, the version 6 of Land Surface Temperature (LST) products, MOD11C2 and MYD11C2 V006, ceased to provide data after November 2022. Additionally, Sea Surface Temperature (SST) data from TERRA was unavailable for October 2022. Given these constraints, this study selected data from January to September for 2022, trying to end this work properly.
The objectives of this research are as follows: (1) to estimate the long-term trends of LST, SST and Earth Surface Temperature (EST) from 21-year MODIS data, and to evaluate the ability of EST in reflecting climate change by comparing it with temperature anomalies provided by the National Oceanographic and Atmospheric Administration (NOAA); (2) to examine the differences in temperature trends between two versions of satellite products, (3) to analyze global, hemispheric, and latitudinal variations in EST for both versions, recognizing that while global warming is widely acknowledged, its intensity varies significantly across regions and latitudes; and (4) to generate trend maps to illustrate the spatiotemporal variations of LST and SST.
2. Data and methods
2.1. MODIS LST and SST data
MOD11C2 and MYD11C2 LST products, including Versions 6 and 6.1, have been used in this research. They are eight-day products generated in a geographic projection at a spatial resolution of 0.05°. Notably, MOD11C2 and MYD11C2 Version 6 products have stopped to provide data since November 16, 2022 and February 26, 2023 respectively, due to significant loss of data retrieval (Wan et al., 2015). Instead, V6.1 serves as a replacement for V6, which was also released by National Aeronautics and Space Administration, United States Geological Survey (NASA-USGS). It provides LST dating back to 2000 and works reliably (Wan et al., 2021). The major improvement of V6.1 over its predecessor, V6, lies in the enhanced calibration and polarization correction approaches (Wan, 2019). According to previous research, the accuracy of V6 LST product is within 1 K in most test cases (Wan, 2014).
MODIS Aqua and Terra Level 3 SST Thermal IR 8-day 4 km products are obtained for sea surface temperature. The SST products are provided at 4.63 km spatial resolution for both daytime and nighttime in the format of netCDF-4. The accuracy of the SST products is considered as 0.4 K (NASA, n.d.).
2.2. NOAAGlobalTemp anomalies
NOAA Global Surface Temperature (NOAAGlobalTemp) integrated SST and land-surface air temperature, provides long-term temperature anomalies with respect to the average of 1901-2000, at global and hemispheric scales (NOAA, n.d.). Additionally, NOAA provides monthly and annual global climate report, showing the patterns and trends of NOAAGlobalTemp. It is important to note the spatial disparities in station distribution, with significantly sparser coverage in the Southern Hemisphere.
2.3. EST calculation
The LST and SST for each 8-day composited image are calculated using MODIS Aqua data collected at 1:30 and 13:30 and Terra data at 10:30 and 22:30 (local solar time), as follows:
![\[ SST_{MODIS} = \frac{SST^{(01{:}30)}{mean} + SST^{(10{:}30)}{mean} + SST^{(13{:}30)}{mean} + SST^{(22{:}30)}{mean}}{4} \qquad (1)\]](https://www.recentadvancesin.com/wp-content/ql-cache/quicklatex.com-13d795cbdedeeed91ec439a46ac4b329_l3.png "Rendered by QuickLaTeX.com")
![\[ LST_{MODIS} = \frac{SST^{(01{:}30)}{mean} + SST^{(10{:}30)}{mean} + SST^{(13{:}30)}{mean} + SST^{(22{:}30)}{mean}}{4} \qquad (2)\]](https://www.recentadvancesin.com/wp-content/ql-cache/quicklatex.com-a658f365b8c368d7421cd56d86f81e4d_l3.png "Rendered by QuickLaTeX.com")
Where SSTtmean and LSTtmean are estimated by:
![\[ SST^{t}{mean} = \frac{1}{A{total}} \sum_{i=1}^{n} \sum_{j=1}^{m} A_{ij} \, SST^{t}_{ij} \qquad (3)\]](https://www.recentadvancesin.com/wp-content/ql-cache/quicklatex.com-416b7a96a41745b0b83e05e14a30a0cc_l3.png "Rendered by QuickLaTeX.com")
![\[ LST^{t}{mean} = \frac{1}{A{total}} \sum_{i=1}^{n} \sum_{j=1}^{m} A_{ij} \, LST^{t}_{ij} \qquad (4)\]](https://www.recentadvancesin.com/wp-content/ql-cache/quicklatex.com-ceb69e8407c85d300d091bfc9cd3b042_l3.png "Rendered by QuickLaTeX.com")
SSTtij and LSTtij are the values of SST and LST for the pixel (i,j) at the time t. m and n are the number of columns and rows of the satellite image, Aij is the area of each pixel, and Atotal is the area sum of considered pixels.
In the production of MODIS products, the clouds are masked using the MODIS Cloud Mask product (MOD35_L2) (Wan, 2019). Besides that, cloud-contaminated pixels in MODIS data were not post-processed. However, LSTMODIS and LSTMODIS that deviated by more than 5 standard deviations from the average were removed. Then, the annual mean LST and SST were calculated using the remaining dates.
For regional analysis, the surface temperature has been calculated based on hemisphere and latitude. Six latitudinal zones include the boreal zone (90°N – 66.5°N), northern temperate zone (66.5°N – 23.5°N), northern tropical zone (23.5°N – 0), southern tropical zone (0 – 23.5°S), southern temperate zone (23.5°S – 66.5°S) and austral zone (66.5°S – 90°S).
The Earth Surface Temperature (EST) is estimated by weighting the LST and SST according to the area percentage of land and sea pixels, calculated using the following formula:
![\[ EST = \frac{A_{SST} \times SST_{MODIS} + A_{LST} \times LST_{MODIS}}{A_{SST} + A_{LST}} \qquad (5)\]](https://www.recentadvancesin.com/wp-content/ql-cache/quicklatex.com-afb24f720da6eacc0b886bda7ec8adf2_l3.png "Rendered by QuickLaTeX.com")
Where ASST and ALST represent the area of pixels covered by sea and land, respectively.
2.4. EST annual trends versus NOAA anomalies
EST trend from 2003 to 2023 are calculated by linear regression and further compared with NOAA temperature anomalies. Notably, due to the lack of TERRA SST data in October 2022 (NASA, 2022), this study only includes MODIS data gathered from January to September in 2022. When calculating the annual trends, data of 2022 was not considered. Fortunately, complete full-year datasets are accessible for the remaining years. For comparisons in 2022, the observation of satellite data covers until September 29, aligning closely with the time span of NOAA temperature statistics, which extends from January 1 to September 30. Since there is only one day difference between both datasets, this comparison is acceptable.
3. Results
3.1. MODIS EST versus NOAA anomalies
Fig.1 shows the EST from MODIS V6 and V6.1, and the NOAA-NCDC temperature anomalies, which are with respect to the 1901-2000 average. The Pearson correlation coefficient (r) between EST V6 and NOAA-NCDC temperature anomalies is 0.923. In contrast, the r between EST V6.1 and NOAA-NCDC anomalies is 0.935, which is slightly higher than that of V6.
The linear trends of EST V6 and V6.1 are 0.021 ± 0.004°C/yr. and 0.025 ± 0.004°C/yr., respectively. The global temperature anomaly from NOAA-NCDC shows a linear trend of 0.024 ± 0.003°C/yr., which aligns more closely with EST V6.1.
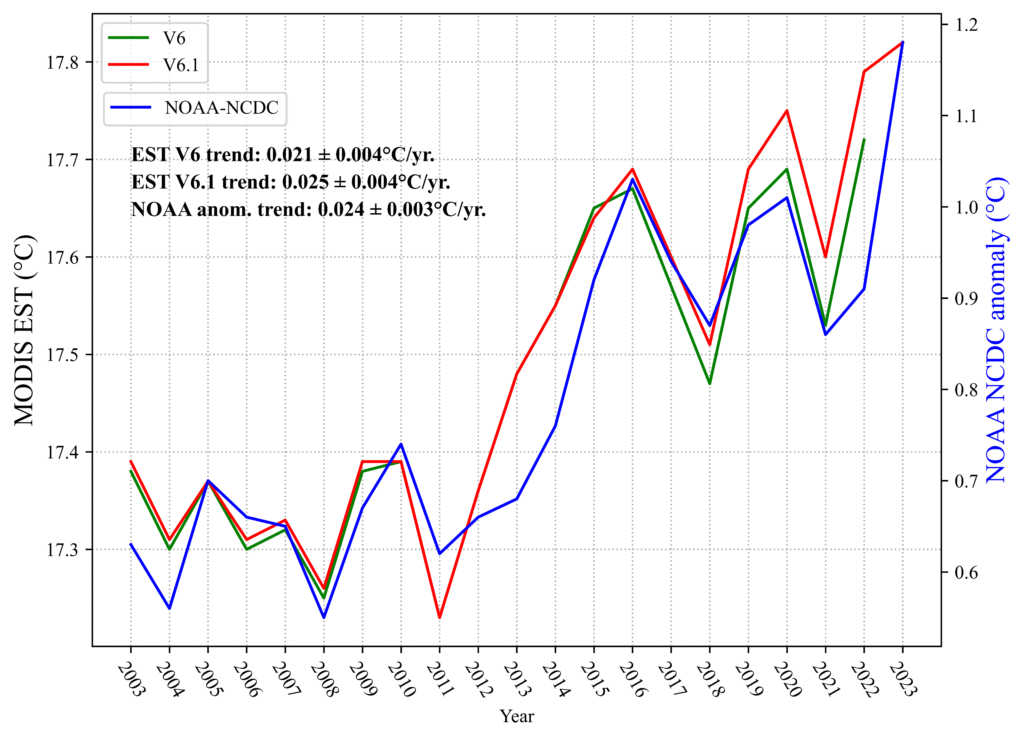
Fig.1. MODIS EST versus NOAA-NCDC temperature anomalies.
3.2. Regional analysis
3.2.1. Global and hemispheric analysis
The LST, SST and EST for global and hemispheric regions are derived from MODIS version 6.1 (Fig.2). For the sake of brevity, the same analysis for MODIS version 6 is not presented here, although the corresponding results are presented in Tables 1 and 2. The dataset covers the period from 2003 to 2023, with the year 2022 left blank due to incomplete data.
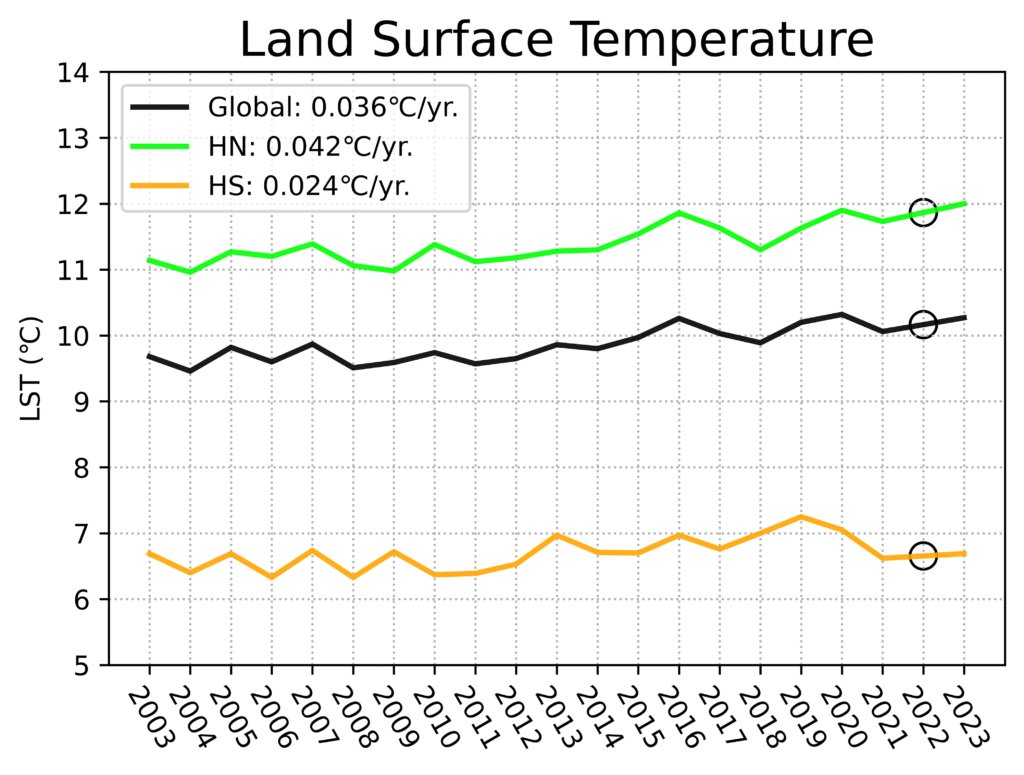
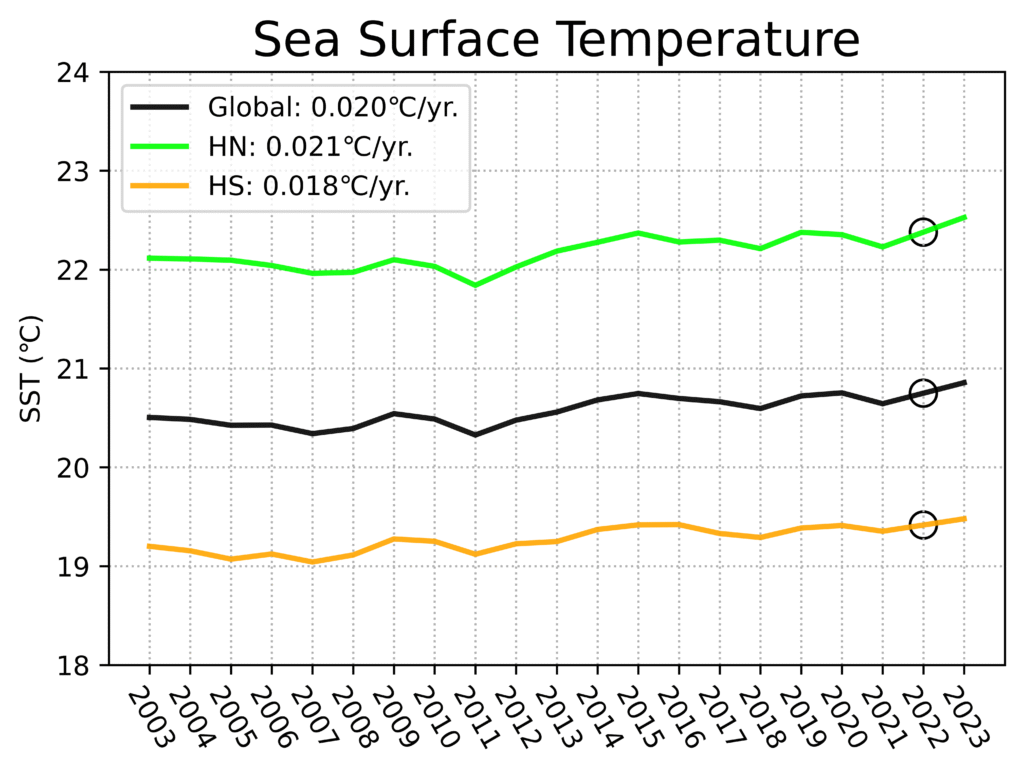
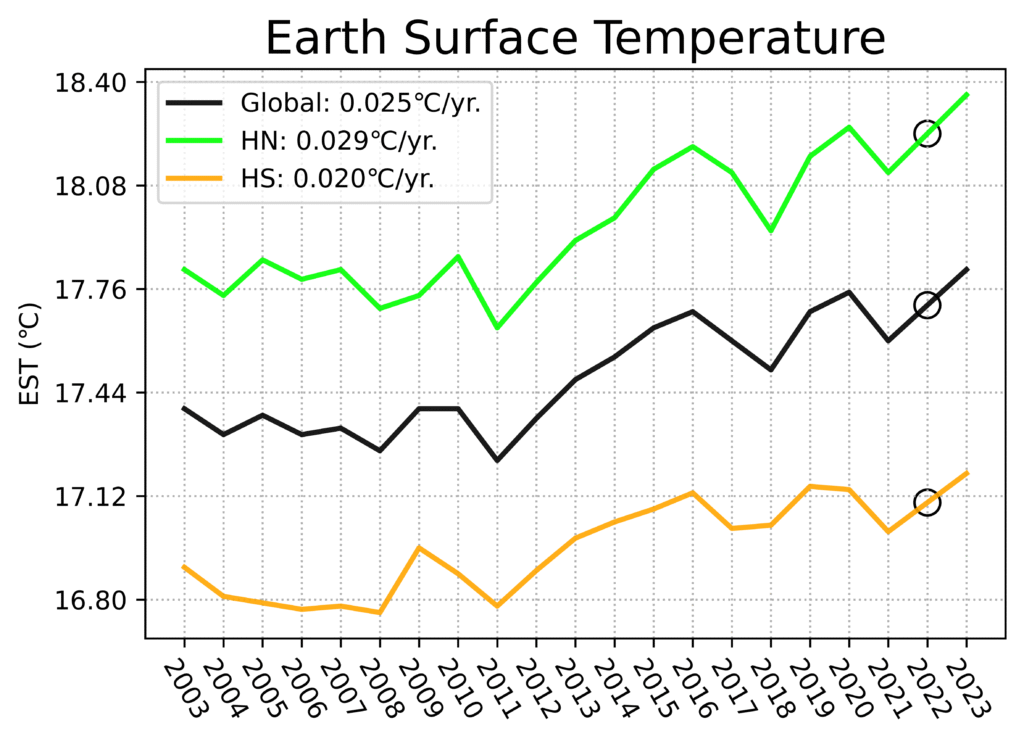
Fig.2. MODIS V6.1 LST, SST, EST in the HN (green), HS (orange) and global (black) from 2003 to 2023. Data for 2022 is not available (marked as “○”)
Overall, LST, SST and EST all exhibit a gradual upward trend. Notably, the measurements recorded in the northern hemisphere tend to surpass those in the southern hemisphere. Regionally speaking, LST HN has risen significantly (0.042°C/yr.), with LST HS increasing with a relatively lower rate (0.024°C/yr.), which results in an increase in LST global (0.036°C/yr.). Not taking 2022 into consideration, the hottest years for land are 2020, 2023, 2016 and 2019. For SST, the increasing tendency in SST is lower than that of LST: 0.020°C/yr. for global SST, 0.021°C/yr. for HN SST and 0.018°C/yr. for HS SST, respectively.
EST has shown an upward trend, reaching its peak in 2023, especially higher in the northern hemisphere. The hottest years of EST are 2023, 2020, 2019 and 2016. Overall, the global EST increases at a speed of 0.025°C/yr.
According to the NOAA climate report (NOAA, 2024), the global temperature in 2023 reached the unprecedented level since the record began in 1850, which is 1.18℃ above the 1901-2000 average. The warmest years are sorted as follows: 2023, 2016, 2020, 2019, 2017. In addition, 2022 was the seventh warmest year, at 0.91°C above the 20th century average of 13.9°C. Although these rankings are slightly different with the EST results, they both reflect an obvious warming trend in recent years.
3.2.2. Latitudinal zone analysis
In addition, the latitudinal trends of LST, SST and EST were obtained using the linear regression method. For version 6, data from 2003 to 2021 was utilized, while for version 6.1, the data covers the period from 2003 to 2023, excluding the year 2022.
From the results of V6 (Table 1), the EST global trend estimated by MODIS data is 0.021°C/yr., which means the earth surface heat up at a rapid rate of 0.21°C per decade and 2.1°C per century. The EST trends for northern and southern hemisphere are 0.023°C/yr. and 0.018°C/yr., respectively. In contrast, the EST trends from NOAA-NCDC anomalies for global, northern and southern hemisphere are 0.023°C/yr., 0.034°C/yr. and 0.013°C/yr., respectively.
It is worth noting that the global LST is warming faster than the global SST, particularly in the northern hemisphere, with rates of 0.030°C/yr. and 0.018°C/yr. for LST and SST, respectively. The warming trends in the southern hemisphere are same for both LST and SST at 0.018°C/yr.
Table 1. LST, SST and EST linear trends for 2003-2021 at global, hemispherical and latitudinal scales from MODIS V6 data.
| Zone | LST (°C/yr.) | LST (°C/yr.)SST (°C/yr.) | EST (°C/yr.) |
| 66.5°N -23.5°N | 0.031 | 0.025 | 0.028 |
| 23.5°N – 0 | 0.008 | 0.022 | 0.019 |
| 0 – 23.5°S | 0.018 | 0.021 | 0.02 |
| 23.5°S – 66.5°S | 0.015 | 0.016 | 0.015 |
| 66.5°S – 90°S | 0.003 | -0.006 | -0.001 |
| HN | 0.030 | 0.018 | 0.023 |
| HS | 0.018 | 0.018 | 0.018 |
| Global | 0.026 | 0.018 | 0.021 |
| NOAA HN | 0.046 | 0.025 | 0.034 |
| NOAA HS | 0.019 | 0.012 | 0.013 |
| NOAA Global | 0.038 | 0.017 | 0.023 |
Table 2 presents the linear trend coefficients from MODIS V6.1 over the period 2003 to 2023, with the year 2022 omitted. The EST global trend is 0.025°C/yr., which is close to the results obtained by NOAA-NCDC: 0.026°C/yr. For the northern and southern hemispheres, the trends of EST are 0.029°C/yr. and 0.020°C/yr., respectively. Compared with Table 1, adding the data of 2023 makes the warming speed of EST even faster.
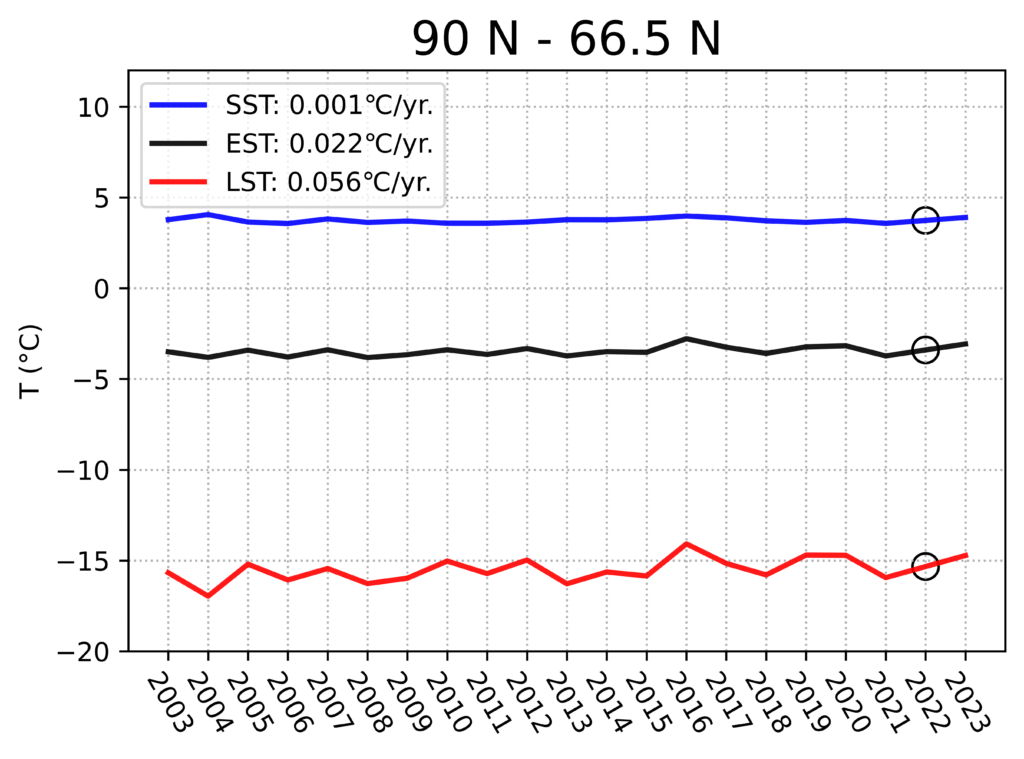
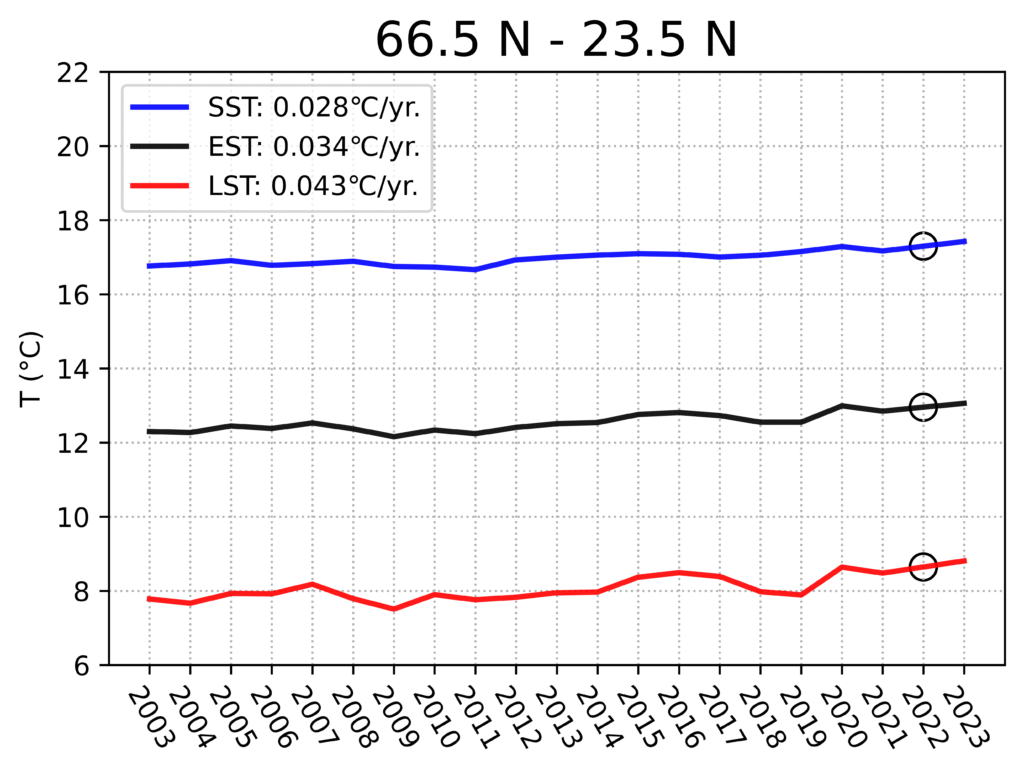
Meanwhile, similar to Table 1, the boreal zone (90°N – 66.5°N) exhibits the highest heating rate of LST at 0.056°C/yr., which poses a significant threat to the accelerated melting of Arctic ice. For SST and EST, the northern temperate zone (66.5°N – 23.5°N) is the region with the fastest warming with 0.028°C/yr. and 0.034°C/yr., respectively.
The global trends for land, sea and entire earth surface are 0.036°C/yr., 0.020°C/yr. and 0.025°C/yr., respectively. It is clear that land warms faster than the ocean. Whether for LST, SST or EST, the northern hemisphere warms faster than the southern hemisphere.
Table 2. LST, SST and EST linear trends for 2003-2023 at global, hemispherical and latitudinal scales from MODIS V6.1 data.
| Zone | LST (°C/yr.) | LST (°C/yr.)SST (°C/yr.) | EST (°C/yr.) |
| 90°N – 66.5°N | 0.056 | 0.001 | 0.022 |
| 66.5°N -23.5°N | 0.043 | 0.028 | 0.034 |
| 23.5°N – 0 | 0.028 | 0.024 | 0.025 |
| 0 – 23.5°S | 0.031 | 0.022 | 0.025 |
| 23.5°S – 66.5°S | 0.024 | 0.015 | 0.017 |
| 66.5°S – 90°S | -0.003 | -0.006 | 0.002 |
| HN | 0.042 | 0.021 | 0.029 |
| HS | 0.024 | 0.018 | 0.020 |
| Global | 0.036 | 0.020 | 0.025 |
| NOAA HN | 0.050 | 0.027 | 0.037 |
| NOAA HS | 0.021 | 0.014 | 0.015 |
| NOAA Global | 0.041 | 0.019 | 0.026 |
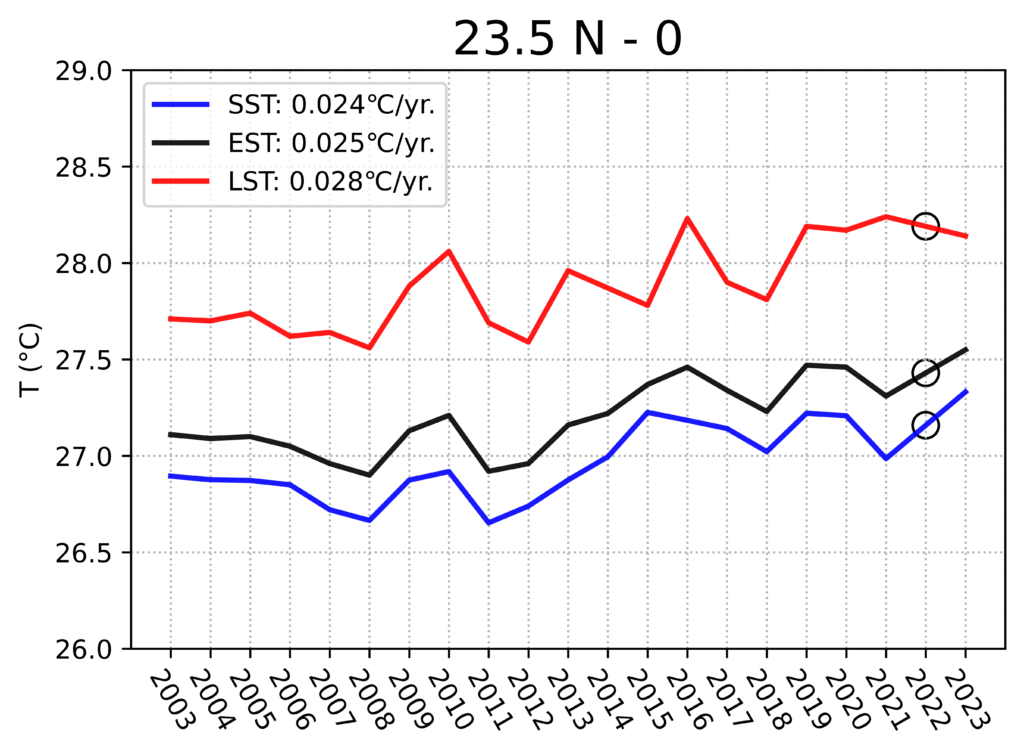
Annual LST, SST and EST according to latitudinal zones are presented in Fig.3. It is noted that LST varies more dramatically over time than SST. Moreover, the range of LST values tends to increase with latitude. For example, in the 90°N – 66.5°N, LST varies from – 16.96°C to -14.08°C with a difference of 2.88°C; in the 66.5°N – 23.5°N, the LST varies between 7.51°C and 8.81°C, with a range of 1.3°C. However, in the 23.5°N – 0, LST ranges from 27.56°C to 28.24°C, recording a difference of 0.68°C.
Northern Hemisphere
Southern Hemisphere
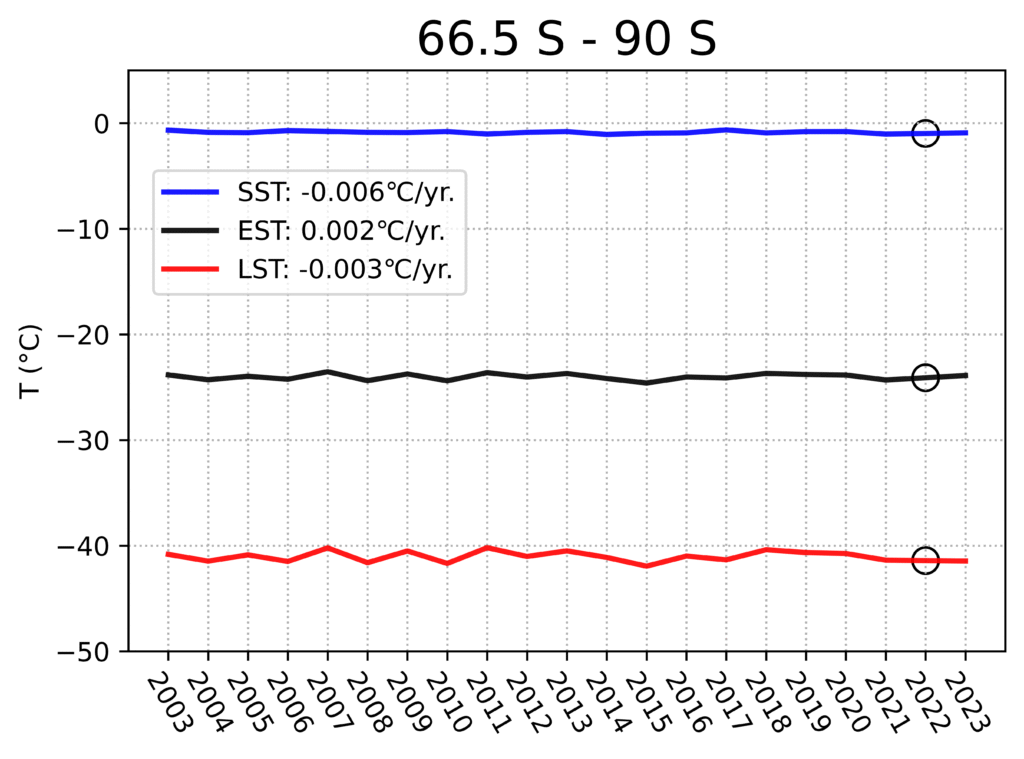
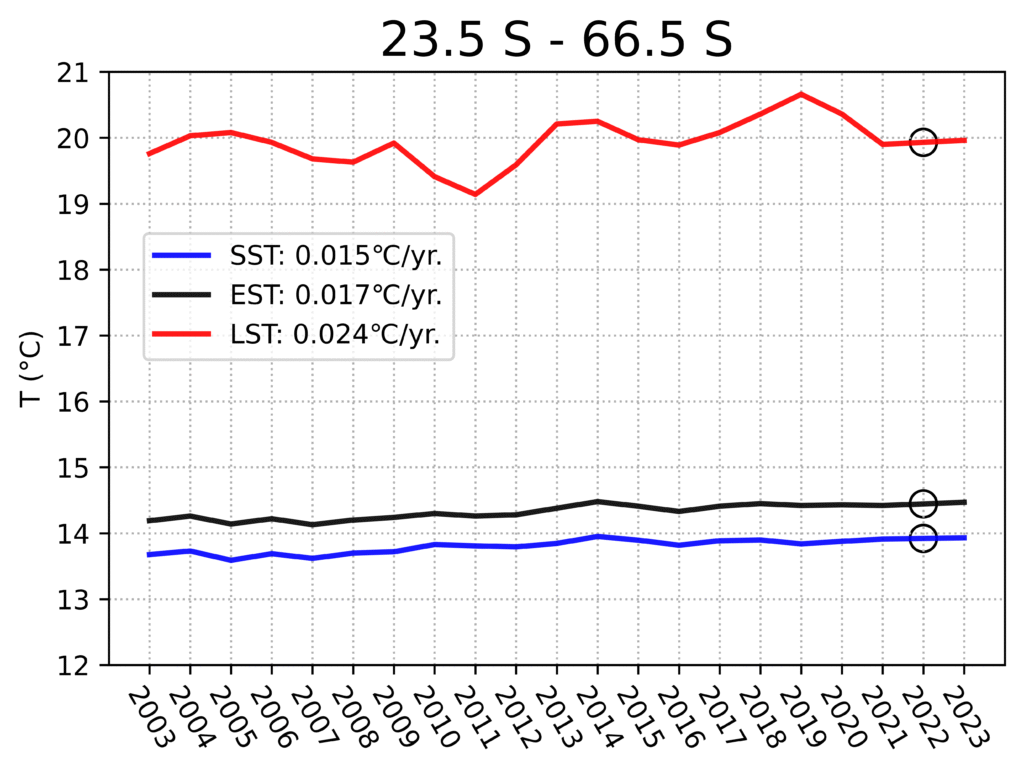
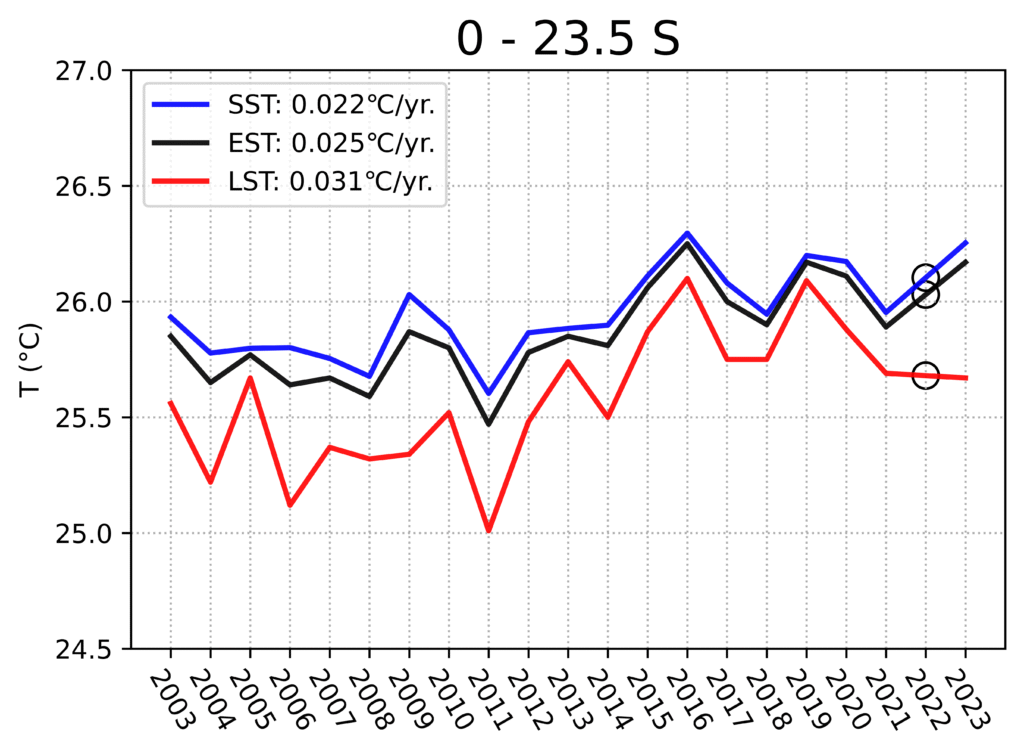
Fig.3. Latitudinal MODIS V6.1 LST (red), SST (blue) and EST (black) during the period 2003-2023. Data for 2022 is not available (marked as “○”)
3.3. MODIS EST V6 versus V6.1
Given the absence of SST data from the TERRA satellite in October 2022, this study adopted a 12-month cycle from October of the previous year to September of the subsequent year to depict the yearly EST trend (Fig.4). Therefore, there is a twenty-year period. For instance, the cycle spanned from October 2002 to September 2003 will be labeled as the year 2003, and so on. The EST trends derived from two versions of MODIS data exhibit a striking similarity, with a correlation coefficient (r) of 0.99. However, the EST from V6.1 is slightly higher than V6, especially for the period from 2016 to 2022. The linear trend of EST V6 is estimated as 0.018 ± 0.004°C/yr, while EST V6.1 demonstrates a higher trend of 0.021 ± 0.004°C/yr.
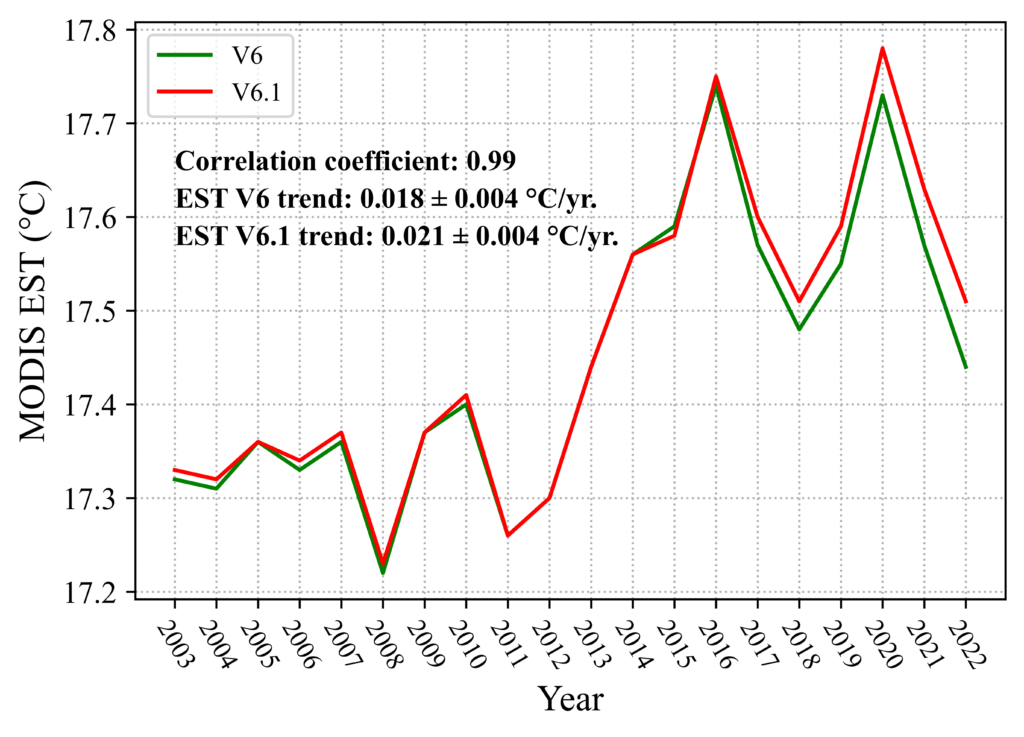
Fig.4. Comparison of MODIS EST between version 6 and 6.1, with a cycle spanning from October to September of the following year.
This section compares the LST and EST derived from MOD11C2/MYD11C2 Version 6 and 6.1, since SST is derived from a different dataset (see section 2.1). The global and hemispheric LST and EST, as well as their differences between two versions are illustrated in Fig.5. The selected data spans from October 2002 to September 2022.
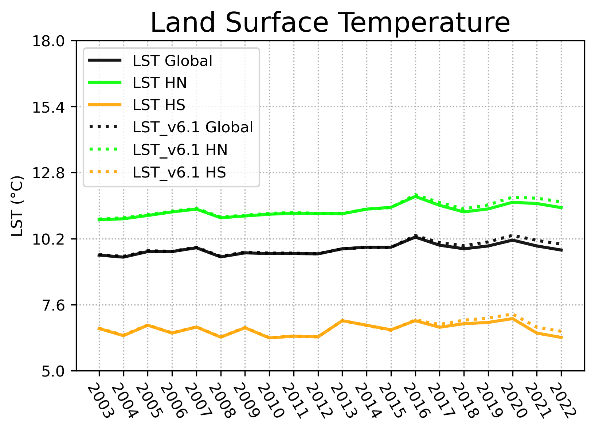
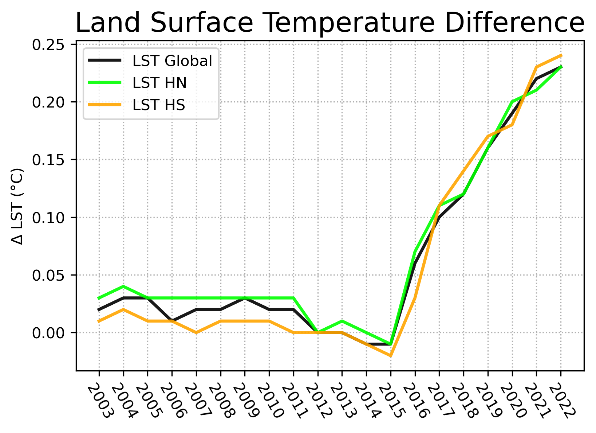
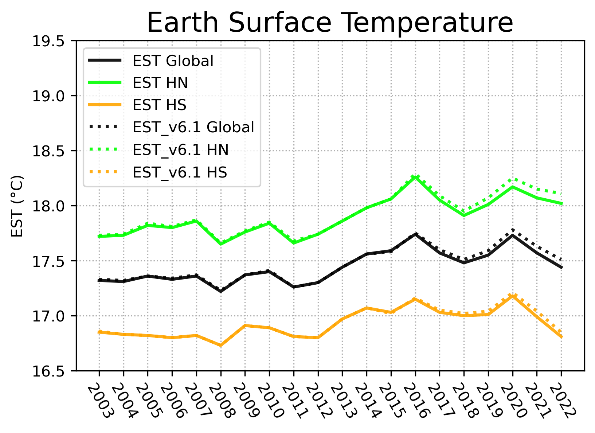
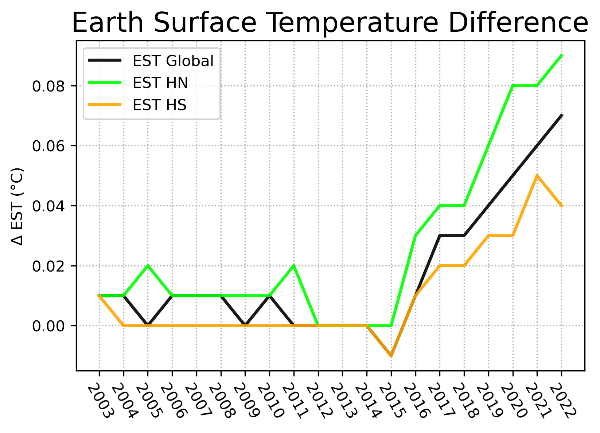
Fig.5. LST and EST from MODIS V6 and V6.1 in the HN (green), HS (orange) and global (black). (a) V6 and V6.1 LST from October 2002 to September 2022, (b) V6 and V6.1 EST from October 2002 to September 2022, (c) the LST difference between two versions, (d) same as c) for EST.
From Fig.5, the LST and EST derived from MODIS version 6 and 6.1 present similar trends, with values of V6.1 being slightly higher than those of V6 as indicated in Fig.5a-5b, particularly from 2016 to 2022. Regarding EST, the northern hemisphere shows a bigger difference between the two versions of MODIS data compared to the southern hemisphere (Fig.5d), explained by the lesser extent of emerged lands in this latter.
The LST difference (Fig.5c) varies from -0.02 to 0.24°C, with the global, HN and HS zones all reaching their highest values during 2021 to 2022 at 0.23°C, 0.23°C and 0.24°C, respectively. Since 2016, the LST difference between both versions tends to expand, which leads to a larger EST difference (Fig.5d), peaking in the period from 2021 to 2022: global difference is 0.07°C, HN and HS differences are 0.09°C and 0.04°C, respectively. Between 2013 and 2015, there is a period where the LST and EST of V6.1 are lower than those of V6. From October 2014 to September 2015, the LST differences at global, HN and HS are -0.01°C, -0.01°C and -0.02°C, respectively; as for the EST, the discrepancies between both versions are subtle, with only a -0.01°C difference observed in 2015 in the global and HS zones.
3.4. Annual trend and MK test
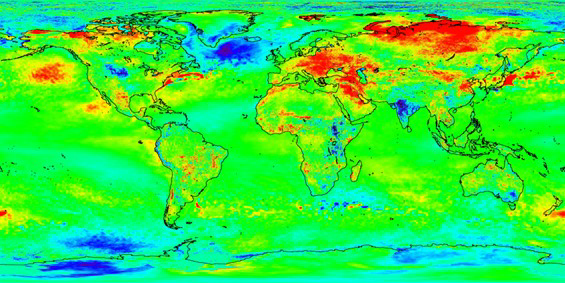
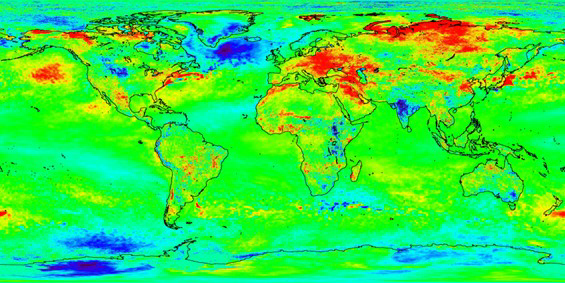
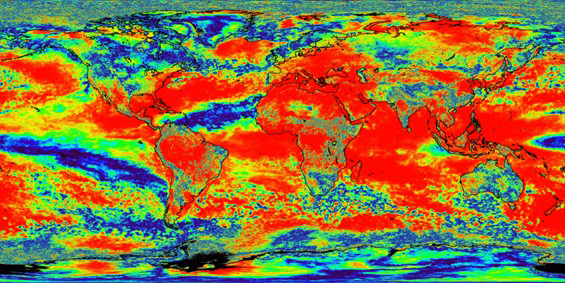
Furthermore, the LST and SST annual trends were estimated by linear regression and Sen’s slope method (Sen, 1968). The Mann-Kendal test (Kendall, 1948) was conducted to quantify the significance level (Fig.6). Since the data for 2022 is incomplete, the trend analysis was performed using data of MODIS V6.1 from 2003 to 2023, excluding 2022.
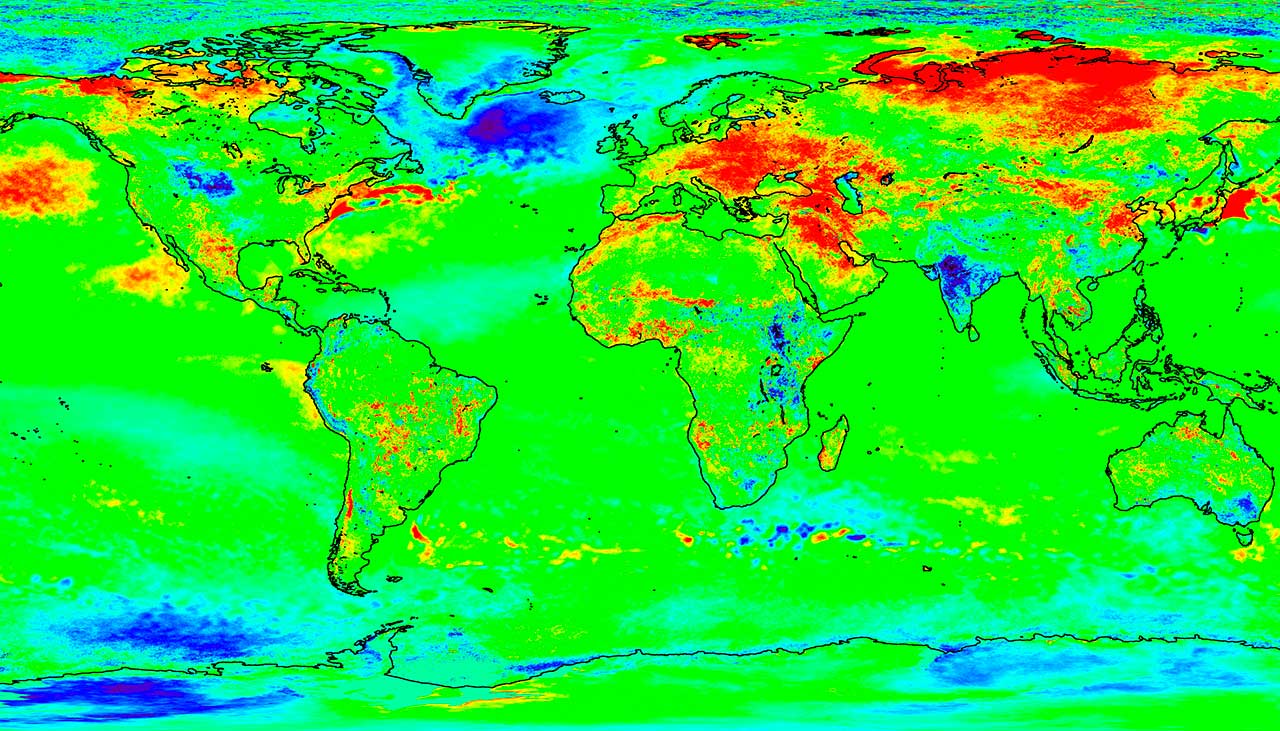
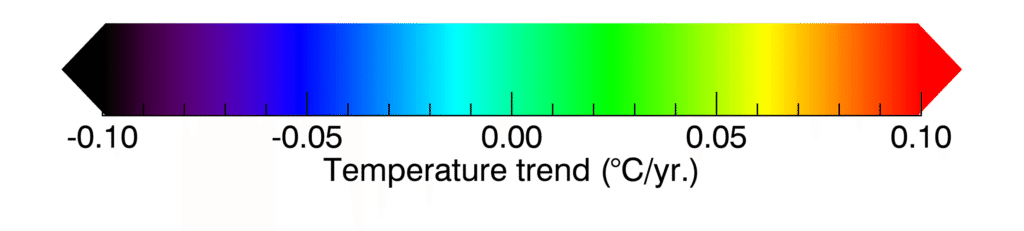
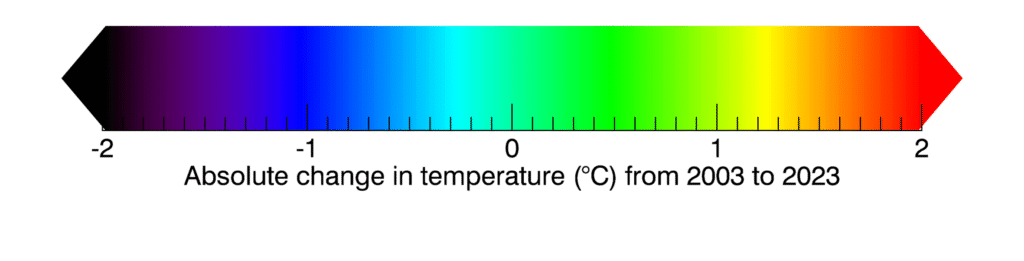
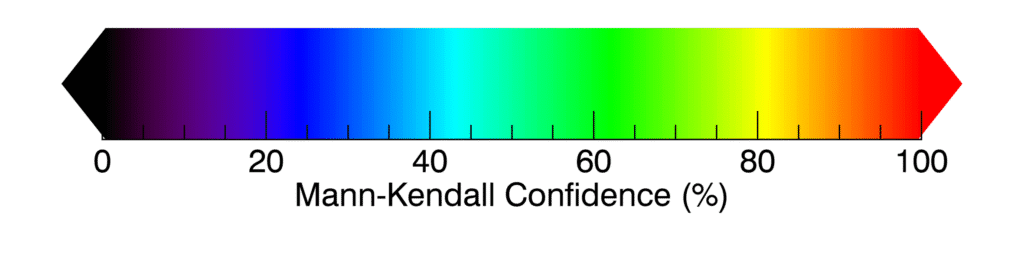
The results of the linear regression (Fig.6a) and Sen’s slope method (Fig.6b) illustrate a consistent spatial pattern of temperature trends: a noticeable warming trend is observed mainly in northern hemisphere, including northern Eurasia and central Europe; while a clear cooling trend is evident in the North Atlantic, peninsular India and certain regions of Antarctica. The Mann-Kendall test map (Fig.6c) indicates the confidence level at the pixel scale. In the MK map, a higher confidence level indicates that the temperature trend is more significant.
(a) Linear method
(b) Sen’s slope method
(c) Mann-Kendall test
Fig.6. LST and SST trend from MODIS V6.1 data for the period 2003-2023 estimated by (a) linear regression and (b) Sen’s slope method, (c) Mann-Kendall test map.
4.Discussion
4.1. Comparisons with previous work
According to previous studies, the EST trend was 0.018 ± 0.007°C/yr. based on MODIS data from 2003 to 2016 (Sobrino et al., 2020b), and increased to 0.021 ± 0.001°C/yr. when the analysis was extended to include data up to 2019 (Sobrino et al., 2020a). The EST trends in this study were 0.021 ± 0.004°C/yr. for MODIS V6 data from 2003 to 2021, and 0.025 ± 0.004°C/yr. for MODIS V6.1 data from 2003 to 2023, respectively. This indicates that the trend of EST has further increased.
4.2. Comparisons between MODIS V6 and V6.1
When using the same research period (Section 3.3), the EST from MODIS V6.1 became significantly higher since the period of 2015-2016, with a higher trend of 0.021 ± 0.004°C/yr. compared to 0.018 ± 0.004°C/yr. for EST from MODIS V6. The global and hemispheric trends from October 2002 to September 2022 are outlined in Table 3.
First, the LST and EST from V6.1 are significantly higher than those from V6, and the trends in the HN are notably higher than those in the HS. The global trend of NOAA anomalies (0.022°C/year) is closer to EST V6.1 (0.021°C/year). However, there are certain discrepancies between EST trends from NOAA anomalies and MODIS at the hemispheric level: the trends of NOAA are higher in the HN and slightly lower in the HS, which may be related to the uneven distribution of meteorological stations in the NOAAGlobalTemp dataset.
Table 3. Linear trends of LST and EST for both versions of MODIS data and NOAA anomalies, with the 12-month cycle from October of the previous year to September of the following year.
| Global (°C/yr.) | HN (°C/yr.) | HS (°C/yr.) | |
|---|---|---|---|
| LST V6 | 0.023 | 0.029 | 0.011 |
| LST V6.1 | 0.033 | 0.039 | 0.022 |
| EST V6 | 0.018 | 0.022 | 0.014 |
| EST V6.1 | 0.021 | 0.026 | 0.016 |
| NOAA | 0.022 | 0.033 | 0.012 |
4.3. Limitation and prospective
This study was affected by missing data and did not include 2022 in the annual analysis. According to the NOAA Annual 2023 Global Climate Report, the temperature anomaly for 2022 ranked seventh, following 2023, 2016, 2020, 2019, 2017 and 2015. Both 2021 and 2022 were influenced by a La Niña cold phase.
Furthermore, this study did not fill cloud-contaminated pixels, which may introduce errors in the EST estimation. Specifically, cloud covered areas tend to present lower temperature than their cloud-free counterparts in summer, and higher in winter. To address this limitation, future research should explore methods for reconstructing temperature under cloud cover, with the integration of thermal infrared and microwave data as a potential approach.
5. Conclusions
This paper updates the work of Sobrino et al. (2020a; 2020b). However, what distinguishes this research is its extension of the period to 2023 and the addition of comparisons between different versions of MODIS data. The past 21 years of global earth surface temperature were calculated and analyzed. Since the MOD11C2 and MYD11C2 V6 products have ceased providing data, their updated version, the V6.1 products were used in this study for obtaining LST and comparative analysis. SST data from TERRA is missing for October, 2022, so the calculation of EST in 2022 only utilizes data from January to September. When it comes to the annual trend, the year 2022 is often not considered.
The EST trends from LST V6 and V6.1 are 0.021 ± 0.004°C/yr. and 0.025 ± 0.004°C/yr., respectively. When compared to the tendency of NOAA temperature anomalies, which is 0.024 ± 0.003°C/yr., the results from V6.1 are more closely aligned. Therefore, it confirms the capability of EST to reflect the global surface temperature. Moreover, the comparisons between two versions evidently reveal that LST and EST of V6.1 are slightly higher than those of V6, especially during 2016 to 2022.
The results of regional analysis show the EST V6 trends for global, northern and southern hemisphere are 0.021°C/yr., 0.023°C/yr. and 0.018°C/yr., respectively. EST V6.1 trends for global, northern and southern hemisphere are 0.025°C/yr., 0.029°C/yr. and 0.020°C/yr. respectively, sharing a similar pattern with the outcomes of NOAA anomalies for global (0.026°C/yr.). The EST tendencies reflect that the northern hemisphere warms faster than the southern hemisphere, land warms faster than sea, and temperature rises more rapidly in the northern temperate zone (66.5°N – 23.5°N).
Finally, the annual LST and SST trends from 2003 to 2023 were depicted by linear regression and Sen’s slope method using data derived from version 6.1. The trend maps show significant spatial heterogeneity: a warming trend emerged in northern Eurasia and central Europe, while a cooling trend was observed in the North Atlantic, peninsular India and some regions of Antarctica. Using MODIS data over the past twenty-one years, this study calculated the Earth surface temperature and its annual trend, eventually revealing that the global surface is warming by approximately 0.021 to 0.025°C per year, depending on the MODIS dataset considered.
Author Contributions
José A. Sobrino: Conceptualization, Methodology, Algorithms, Data Analysis, Writing – original draft, Writing – review & editing, Funding acquisition. Letian Wei: Data extraction, Data Analysis, Writing – original draft, Writing – review & editing. Yves Julien: Software, Data Analysis, Writing – review & editing. Susana García-Monteiro: Software.
Declaration of competing interest
The authors declare that they have no known competing financial interests or personal relationships that could have appeared to influence the work reported in this paper.
Acknowledgements
The authors thank the NASA Land Processes Distributed Active Archive Center and Physical Oceanography Distributed Active Archive Center and the NOAA teams for making data freely available. Letian Wei is supported by the China Scholarship Council (No. 202204910089).
Funding
This research was funded by the Ministerio de Ciencia, Innovación y Universidades projects PID2020-112494RB-I00 and PID2023-150737OB-I00.
References
Kendall, M. G. (1948). Rank correlation methods.
Najafzadeh, F., Mohammadzadeh, A., Ghorbanian, A., et al. (2021). Spatial and temporal analysis of surface urban heat island and thermal comfort using landsat satellite images between 1989 and 2019: A case study in Tehran. Remote Sensing, 13(21), 4469.
NASA Jet Propulsion Laboratory. (n.d.). Summary of MODIS Sea Surface Temperature (SST) Products. https://archive.podaac.earthdata.nasa.gov/podaac-ops-cumulus-docs/modis/open/L3/docs/modis_sst.html. Accessed 2025-05-22.
NASA Jet Propulsion Laboratory. (2022). Terra satellite data outage during 10–19 October 2022. https://podaac.jpl.nasa.gov/announcements/2022-09-29-Terra-satellite-data-outage-during-10-19-October-2022. Accessed 2025-05-22.
Nill, L., Ullmann, T., Kneisel, C., et al. (2019). Assessing spatiotemporal variations of Landsat land surface temperature and multispectral indices in the Arctic Mackenzie Delta Region between 1985 and 2018. Remote Sensing, 11(19), 2329.
NOAA National Centers for Environmental Information. (n.d.). Climate at a Glance Time Series. https://www.ncei.noaa.gov/access/monitoring/climate-at-a-glance/global/time-series/globe/land_ocean/ytd/3/1850-2023. Accessed 2025-05-22.
NOAA National Centers for Environmental Information. (2024). Monthly Global Climate Report for Annual 2023. https://www.ncei.noaa.gov/access/monitoring/monthly-report/global/202313. Accessed 2025-05-22.
NourEldeen, N., Mao, K., Yuan, Z., et al. (2020). Analysis of the spatiotemporal change in land surface temperature for a long-term sequence in Africa (2003–2017). Remote Sensing, 12(3), 488.
Reiners, P., Sobrino, J. A., Kuenzer, C. (2023). Satellite-derived land surface temperature dynamics in the context of global change—A review. Remote Sensing, 15(7), 1857.
Sen, P. K. (1968). Estimates of the regression coefficient based on Kendall’s tau. Journal of the American Statistical Association, 63(324): 1379–1389.
Sobrino, J. A., García-Monteiro, S., Julien, Y. (2020a). Surface temperature of the planet Earth from satellite data over the period 2003–2019. Remote Sensing, 12(12), 2036.
Sobrino, J. A., Julien, Y., García-Monteiro, S. (2020b). Surface temperature of the planet Earth from satellite data. Remote Sensing, 12(2), 218.
Sobrino, J. A., Julien, Y. (2013). Trend analysis of global MODIS-Terra vegetation indices and land surface temperature between 2000 and 2011. IEEE Journal of Selected Topics in Applied Earth Observations and Remote Sensing, 6(5): 2139–2145.
Wan, Z. (2014). New refinements and validation of the collection-6 MODIS land-surface temperature/emissivity product. Remote Sensing of Environment, 140: 36–45.
Wan, Z. (2019). MODIS Collection 6.1 (C61) Product User Guide. https://lpdaac.usgs.gov/documents/715/MOD11_User_Guide_V61.pdf. Accessed 2025-05-22.
Wan, Z., Hook, S., Hulley, G. (2015). MOD11C2 MODIS/Terra Land Surface Temperature/Emissivity 8-Day L3 Global 0.05Deg CMG V006. NASA EOSDIS Land Processes Distributed Active Archive Center. https://doi.org/10.5067/MODIS/MOD11C2.006. Accessed 2025-05-22.
Wan, Z., Hook, S., Hulley, G. (2021). MODIS/Terra Land Surface Temperature/Emissivity 8-Day L3 Global 0.05Deg CMG V061. NASA EOSDIS Land Processes Distributed Active Archive Center. https://doi.org/10.5067/MODIS/MOD11C2.061. Accessed 2025-05-22.
Publisher’s Note
The statements, opinions, and data contained in all publications are solely those of the individual author(s) and contributor(s) and not of Recent Advances S.L. and/or the editor(s). Recent Advances S. L. and/or the editor(s) disclaim responsibility for any injury to people or property resulting from any ideas, methods, instructions, or products referred to in the content.