



Emergency mapping of mud extent in the context of October 29th 2024 flash floods in Valencia
Yves Julien

1*, José A. Sobrino
1, Ana B. Ruescas
2, Carmen Zornoza Gallego
2, Javier Serrano-Lara
2- Image Processing Laboratory, University of Valencia, Spain.
- Department of Geography, University of Valencia, Spain.
* Author to whom correspondence should be addressed.

Abstract
Natural events become disasters when they affect human populations, demanding a rapid, coordinated response supported by accurate geospatial information. Satellite remote sensing (RS) is essential for providing timely and scalable data, especially during flood events where early warning systems, rapid mapping, and post-event analysis are critical. This study focuses on the flash floods that struck València on October 29, 2024. The Image Processing Laboratory and the Department of Geography at the University of València collaborated to collect and analyse data from both citizen science and remote sensing sources. Copernicus Emergency Management Service (CEMS) maps were validated and refined using ground-level reports. A novel mud mapping approach was developed using Sentinel-2 imagery to assess post-flood impacts, offering a wide-scale, synoptic view of the affected areas. The study demonstrates the value of integrating remote sensing and citizen data for effective disaster response and flood impact assessment.Keywords
Mapping, floods, mud, remote sensing, citizen science1. Introduction
Natural events become disasters when they impact people, requiring a swift and coordinated response from multiple organizations. Accurate geospatial information is a keystone, and satellite remote sensing data constitutes one of the most relevant data sources to obtain timely and scalable information.
Ideally, an early warning system should be already in place – which in most cases relies on local or national authorities – followed by fast availability of maps of the area where the event has taken place to accelerate the crisis response when there are lives in danger. Specifically for flood events, forecasts of weather patterns and simulations of hydrological responses can help to prevent and alert the population in the area that will be irremediably affected by the floods. Once the event is over, rapid mapping of the areas is needed. Both in situ reports, mainly brought up by individuals who are actually in the area (i.e., with the use of smartphones), and all kinds of remote sensing images, from drones to satellites, are the main source of data (Jiang et al., 2014; Rosser et al., 2017).
Satellite remote sensing (RS) provides a reliable overview of the situation after the event; yet in many cases the temporal availability is limited for a proper assessment of the event when it is happening or shortly after. The use of optical RS is even more constrained since the clouds are not transparent for them, like in the case of radar or SAR sensors. However, optical satellite images constitute the very first source, and they are used as a reference in rapid mapping due to the easier terrain recognition by a non-expert RS user.
Early warning services provided by the Copernicus programme, like the European Flood Awareness System (EFAS, 2025), are developed to provide comprehensive overviews of ongoing and forecasted floods up to 10 days in advance. Jointly developed by the European Commission (Joint Research Centre, JRC) and the European Centre for Medium-Range Weather Forecasts (ECMWF), it is a hydrological forecast and monitoring system independent of administrative and political boundaries in the greater European domain. It is a component of the Copernicus Emergency Management Service (CEMS). CEMS establishes three types of maps for rapid mapping: i) reference maps with the background knowledge of the area (terrain, settlements, infrastructure); ii) delineation maps, which provide the geographical extent of the event based on data acquired a few hours/days after occurrence; iii) grading maps, with the impact or magnitude of the damages in the area (CEMS). There is also a service on Risk and Recovery Mapping where pre- and post-disaster situation maps are also delivered. At a national or local level, research institutes (CSIC – Consejo Superior de Investigaciones Científicas -, Universities) and regional cartographic services (e.g., Institut Cartogràfic Valencià, ICV) should act as hubs for collecting and analyzing the data and information provided by the different sources.
In the present work the Image Processing Laboratory and the Department of Geography of the University of València, in Spain, joined forces to help with the rapid mapping of the floods that occurred in València the 29th of October 2024. Collection of information from individuals (pictures, videos, personal communications) and RS imagery from several public and private sources started right after the flash flood event that affected several areas in the medium and low parts of the catchment area of the Magre and Turia Rivers and the Rambla del Poyo (riverine). Those three areas have been extensively studied and are even the focus of previous research projects on flood risk mapping (Camarasa-Belmonte and Soriano-García, 2012; Camarasa-Belmonte, 2016).
The delineation maps provided by CEMS a few days after the event, completed with the grading maps, were used as based maps that were validated and corrected with citizen science collaboration. The flash flood in the Rambla del Poyo was especially damaging and caused most of the casualties in the southern part of the city of València, a densely populated area with deficient urban planning. The water filled in streets, garages and the ground floors of practically all villages it encountered on its natural path (Alaquás, Aldaia, Alfafar, Benetusser, Catarroja, Paiporta, Picanya, La Torre and many others). The risk maps generated by Camarasa-Belmonte and Soriano-García in 2012 were so precise that it is even shocking.
Besides the flood-affected area mapping, available from the ICV webmap service (https://visor.gva.es/), we also developed a mud map for several time stamps after the water had been drained. The intensity of the rain (more than 600 mm measured in some stations upstream) and the speed of the process (a few hours), characteristic of these types of semi-arid ephemeral streams, magnified the strength of the flash flood, dragging everything on its way to the lower areas (Camarasa, A.M. and Tilford, K.A., 2002). This created a river of debris and mud that finally covered entire populations until arriving at the sea or at the Albufera lagoon system – natural wetlands and ecosystems that have been severely affected. As part of the emergency response, mud removal has been one of the most challenging and costly operations (CSIC 2024a; 2024b).
The mud maps presented in this study were produced using an innovative approach based on Sentinel-2 imagery from the Copernicus Programme. Although the sensor’s spatial resolution is limited to a maximum pixel size of 10 meters, this is offset by the wide spatial coverage (100 × 100 km), allowing for a comprehensive, synoptic view of nearly the entire flood-affected areas in the middle and lower catchments The paper presents the methodology for the generation of the mud maps from Sentinel-2 after introducing the study area and the flash flood event. The description of the data used, the methods and samples of results follow, concluding with a discussion about the validity of the method and its utility.
2. Study Area and context
2. 1 Study Area
The study focuses on the flooded area in the Province of Valencia along Spain’s Mediterranean coast (Figure 1). The Valencian Region is characterized as a Mediterranean climate that significantly influences its hydrological and environmental dynamics. This climate features hot, characterized by dry summers and mild winters, typical of areas bordering the Mediterranean Basin. The region experiences an average annual precipitation of approximately 500 mm, although this value varies significantly depending on the specific location. In the southern parts of the region, precipitation levels are as low as 300 mm annually, while in the northern areas, these levels can exceed 800 mm (Camarasa-Belmonte and Soriano-García, 2012). This spatial variation is influenced by geographical features such as elevation, proximity to the sea, and prevailing wind patterns. Rainfall in the Valencian Region is unevenly distributed throughout the year, with the most intense and frequent rainfall events occurring in autumn. This seasonal peak is driven by atmospheric instability caused by warm Mediterranean waters interacting with cooler air masses, often leading to heavy and localized downpours. These events, commonly associated with the phenomenon known as gota fría (cold drop), can result in flash floods and significant runoff generation in the region’s ephemeral streams. A secondary rainfall maximum occurs in spring, although it is generally less pronounced than the autumn peak. This bimodal precipitation pattern shapes the hydrology of the region, creating periods of high runoff interspersed with extended dry intervals, which are typical of Mediterranean climates.
These climatic conditions not only influence hydrological processes, they also have broader implications for land use, agriculture, and natural resource management. The intensity of autumn rainfall events poses challenges for flood control and soil erosion, while the dry summer months exacerbate water scarcity issues. The interplay between these seasonal extremes underscores the importance of effective water management strategies in the Valencian region, particularly in the context of climate change, which is expected to amplify the frequency and severity of extreme weather events. This climatic variability is a critical factor in the hydrological behavior of the region’s ephemeral streams, such as the Rambla de Poyo, which are highly responsive to short-duration, high-intensity rainfall events (Camarasa-Belmonte and Soriano-García, 2012).
Rivers Turia and Magre, together with Rambla de Poyo along with other basins in the study area, can be classified into three distinct sectors based on their structural and sedimentary characteristics (Figure 2). These sectors—headwaters, intermediate transition, and downstream floodplains—illustrate the complexity of rainfall–runoff interactions and sediment dynamics in Mediterranean ephemeral streams. The upstream headwaters sector is characterized by permeable rocks such as limestone, dolomites, and sandstone, which are typical of faulted and karstified terrains. This region exhibits rugged relief with numerous fractures and solutional features, allowing for significant water infiltration and storage within subsurface systems. However, despite the high permeability, intense rainfall events can generate surface runoff in this area when precipitation exceeds infiltration capacity. The geomorphology here plays a crucial role in determining the initial hydrological response of the basin, as water flow is concentrated and channeled through narrow valleys and steep gradients. The intermediate transition sector forms a link between the headwaters and the coastal plains. This area is dominated by sedimentary features, including alluvial fans, piedmonts, and glacis, which are formed as torrents emerging from the headwaters lose their transport energy. The reduction in slope steepness leads to sediment deposition, creating transitional landscapes with mixed geomorphological processes. Overland flow from the headwaters often encounters these deposits, leading to partial reabsorption of water and sediments (Camarasa, 2016). This process, known as run-on, redistributes water and sediments across the landscape, adding complexity to the hydrological response (Yair and Raz-Yassif, 2004). These transitional zones act as buffers, modulating the energy and material transported downstream. The downstream floodplain sector is marked by low-sinuosity channels that are efficient conveyors of water and sediment during torrential rainfall events. They often exhibit braided morphologies and carry coarse sediment loads, including gravels and boulders. During heavy rain events, large amounts of gravel and boulders are moved along the streambed, forming a protective layer called an “armored layer”. This layer allows more water to seep into the ground and reduces the amount of water flowing on the surface. This process is a common feature of temporary streams in dry and semi-dry areas.
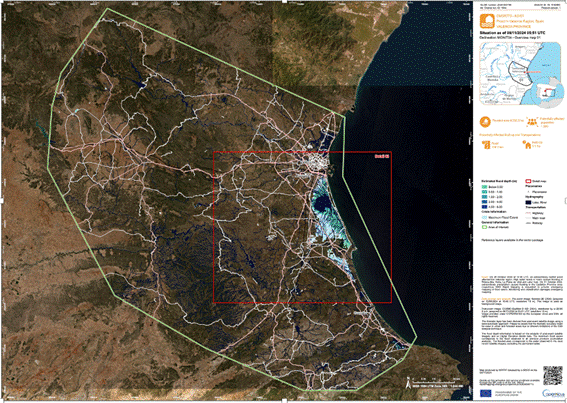
Figure 1. Delimited flooded area by Copernicus Emergency Management Service. The area in red corresponds to the perimeter of the area affected by the Barranc del Poyo and Magre River, closer to Valencia city, while the area in light green indicates the total perimeter, including the flooded areas of the Turia River.
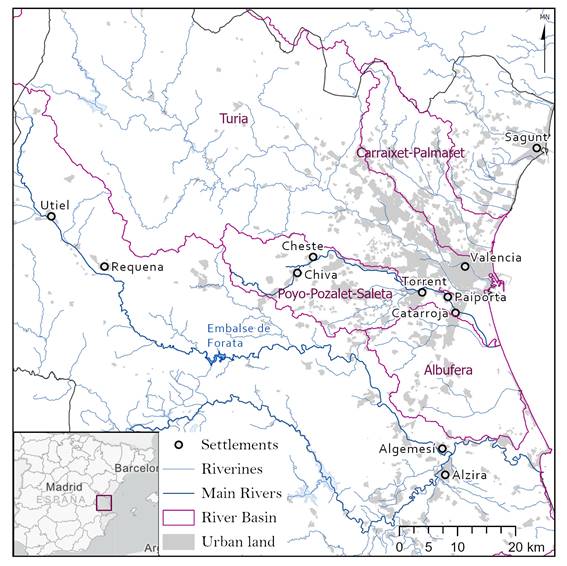
Figure 2. Hydrological network in the study area: delimitation of river basin in yellow; main river in navy; riverine areas in cyan (1/578000).
2. 2 Description of the meteorological event
The meteorological event is related to an isolated high-altitude depression that was affecting the Iberian Peninsula since the 26th of November 2024. The strong advection of easterly winds on the surface, laden with humidity from the Mediterranean and its convergence over a line of storms, favored the formation of intense and continuous precipitation (Figure 3). This train of storms propagated by the effect of the southeast circulation in high layers in a northwesterly direction, reaching populations like Llombai, Buñol, Turís, Chiva, Siete Aguas and especially the Sierras de Utiel and the Atalaya with a natural exit towards the basins of the Magre and Turia river basins (Figure 2). During the morning of the 29th of October, rainfall reached locally very strong intensities, even exceeding 100 mm/h at points downwind of the main focus, propagating the storm train in nearby areas and west of the capital of València in towns such as Torrent, Alaquàs, Aldaia and Riba-roja de Túria. In addition, this convective cell extended again towards the Sierras of Utiel and the Atalaya, continuing in the respective hydrographic basins and leading to fluvial floods. Towards 23:00 local time, the convective focus began to dissipate, and rainfall moderated its intensity from the coast to inland (CEAM, 2024).
Rainfall during the 29th concentrated along the pre-coastal and inland areas, affecting mainly the Plana d’Utiel-Requena and Foia de Bunyol. Among the daily rainfall totals, 491.2 l/m² were recorded in Chiva and 409.0 l/m² in Chera, according to data from the SAIH network (Automatic Hydrological Information System) of the Júcar Hydrographic Confederation (CHJ). Typically, episodes of intense rainfall in the region usually affect mainly coastal and pre-coastal areas. This singularity is probably, together with the torrential intensity of the precipitation, one of the causes of the devastating effect of this episode.
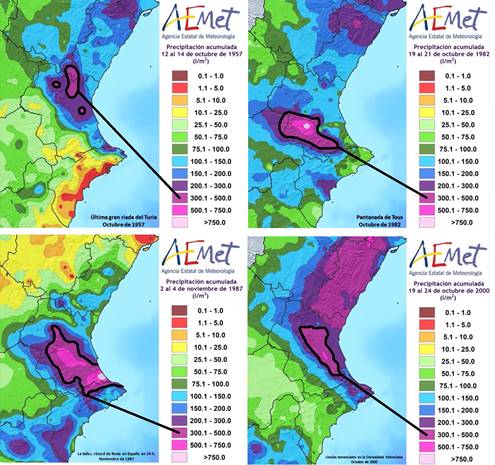
Figure 3. Maps AEMET of accumulated precipitation for historical flooding events.
2.3. Description of the hydrological event
The hydrological event that caused the flood is known as a flash flood. Details about the event are still being studied. However, previous research has shown that many other similar events on these types of ephemeral streams started with accumulated rainfall of around 100 mm/h (Bull et al., 1999; Camarasa-Belmonte, 2016). As it has been pointed out, the intensity and duration of rainfall events are key drivers in flash flood generation. Mediterranean semi-arid zones are prone to convective storms, which can produce extreme precipitation over a short period, as is the case here. When rainfall exceeds the infiltration capacity of the soil, excess water accumulates rapidly, forming runoff that converges into ephemeral stream channels. Soil properties also influence the generation of runoff and the occurrence of the flash flood. In the study area, shallow, poorly structured soils have a low capacity for water retention. Cerda and Doerr (2007) remarked that in these areas, the hydrophobicity property of some soils could cause surface runoff in non-saturated situations. In addition, overgrazing and urban expansion increase the impervious surfaces, which accelerates runoff and transforms riverines into torrents of large volumes of water that cause damaging erosion and sediment transport.
3. Data
3.1 Sentinel-2 data
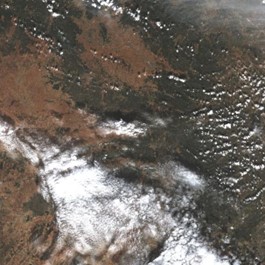
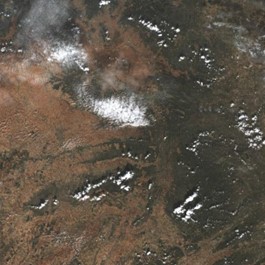
The MSI (MultiSpectral Instrument) instruments onboard the Sentinel-2 satellites (2A and 2B) observe the Earth at 10m spatial resolution every 5 days (using both satellites) in 10 spectral bands from the visible to the near-infrared (NIR). In this work, we used the data from blue, green, red and near-infrared bands, respectively bands 2, 3, 4 and 8. For this study, we downloaded Sentinel-2 Level 2A data for tiles T30SXJ and T30SYJ for August 12th 2024 for reference data (before the flood – Figure 4). As regards post-event data, due to the presence of clouds, we downloaded data for the same tiles for October 31st and November 5th and 10th, 2024 (Figure 5). It represents 8 tiles of 10980 by 10980 pixels at the 10-metre resolution we used in this work. For display purposes, we used an RGB mosaic of Sentinel-2 Level 2 data for August 12th, 2024, from tiles T30SXJ and T30SYJ. This mosaic was used as a base to overlay our results. The images were georeferenced using the information provided in each tile.
| SXJ tile | SYJ tile |
 August 12th 2024 | 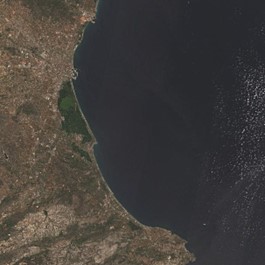 August 12th 2024 |
Figure 4. Reference Sentinel-2 MSI data for false positive discrimination
| SXJ tile | SYJ tile |
 October 31st 2024 | 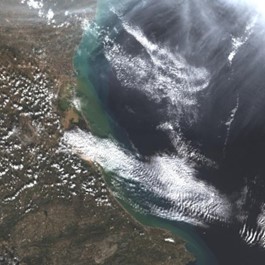 October 31st 2024 |
 November 5th 2024 | 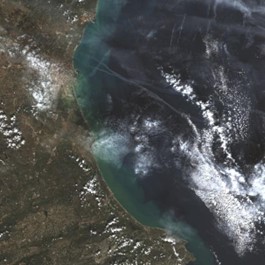 November 5th 2024 |
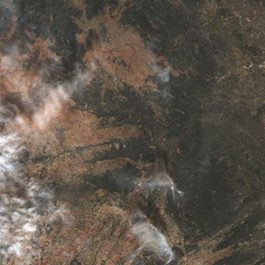 November 10th 2024 | 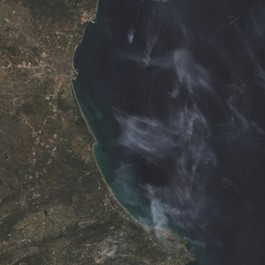 November 10th 2024 |
Figure 5. Post-event Sentinel-2 MSI data for mud masking. The presence of clouds imposes the use of various observation dates.
3.2. Flood mask
For the generation of the map that shows the extent of the flood, we combined data form several sources: satellite imagery and on-the-ground observations provided by citizen science were the main inputs. The process started with the collection of all available satellite images provided by public and private institutions before, during and shortly after the flood event. High-resolution optical or radar images are often used, with radar being particularly valuable during floods because it can penetrate cloud cover and provide clear data in adverse weather conditions. Since on the first days these sources were scarce, and some of them were covered profusely by clouds, the process lasted a couple of weeks. We started working mainly with optical imagery, identifying flooded areas using simple ratios like the Normalized Difference Water Index (NDWI). The use of Landsat 8 and Sentinel-2 imagery gave an overview of the status of the affected areas, but the spatial resolution was not enough to discriminate what happened in heavily urbanized areas.
Super-resolution Sentinel-2 imagery (2.5 m pixel), processed and delivered by Tracasa Global, was used as the basis for the manual correction and digitalization of the flood limits in urban areas. Citizen science played a critical role in refining the map by providing on-the-ground data. Local residents and volunteers report flooded observations through mobile calls, social media, or dedicated apps, with the inclusion of the location and photographs. These reports validate and complement the satellite data, addressing potential inaccuracies. In regions where vegetation or infrastructure obscures satellite detection, local knowledge fills in the gaps. Both satellite and citizen data collected were integrated in a Geographic Information System (GIS) to produce the flood extent map, resulting in a final map that highlights the flood boundaries (Figure 6).
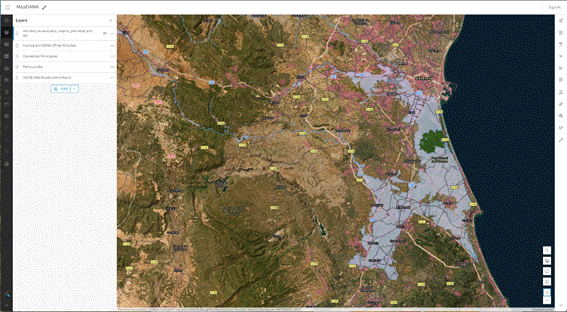
Figure 6. Map viewer and flood extent over the study area (https://uveg.maps.arcgis.com/apps/mapviewer/index.html?webmap=8e6c1d2b364f41c79d27e4dcfdf5475a)
3.3. Validation data
Through the authors’ personal network, we obtained a few validation points in the affected areas. Validation point 1 is a plant nursery, located in a bend of the Barranco de la Horteta, which was almost entirely flooded. Validation point 2 is an individual house, located in a mountainous area north of Cheste, which endured torrential rains (771 mm registered at nearby Turis station on October 29, 2024 – MITECO, 2024). Due to the slope of the terrain, the area was not actually flooded, although a lot of mud was generated and partially carried over downward. Validation Point 3 is a cluster of agricultural fields, located between Valencia and Paiporta, mostly flooded during the October 29 2024 flood event (author J.A.S observation, November 10 2024).
Table 1. Description of validation points
| Point | Coordinates | Observation |
| 1. Plant nursery | 39.424859, -0.537983 | Alluvial plain, flooded on one side of the river |
| 2. Individual house | 39.538825, -0.728929 | Mountainous, torrential rain, running water |
| 3. Paiporta fields | 39.434957, -0.399234 | Agricultural fields north of Paiporta, flooded |
4. Methodology
We provide a simple methodology to identify rapidly the mud present in a given image, without needing of a complete classification of the image. To that end, we selected two areas with obvious mud content, located within the Turia riverbed and the southern part of the Albufera laguna (respectively in blue and red in Figure 7).
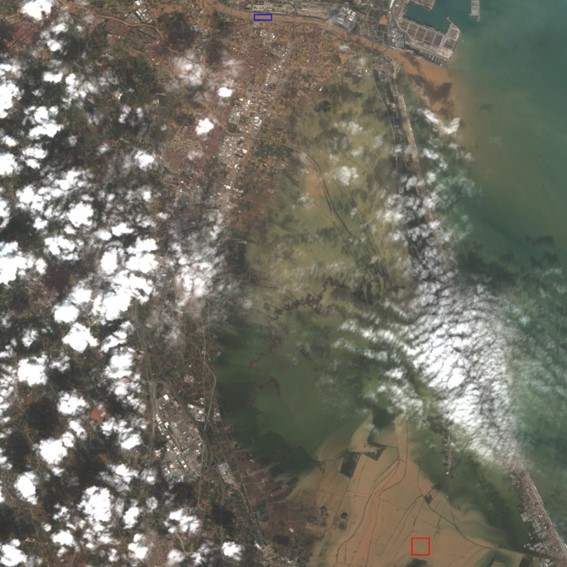 |
Figure 7. Reference areas for mud characterization: Turia riverbed (in blue) and southern Albufera (in red).
Spectral characteristics of the mud in both areas were retrieved through simple mean and standard deviation estimation. These statistics are presented in Table 2. We see that blue, green and red channel data are homogeneous, while NIR channel data are more variable, probably due to varying water content in the mud. Therefore, we use only blue (B), green (G) and red (R) channel data for our mud characterization.
Table 2. Statistics of band reflectivity for the mud in the selected areas.
| Blue | Green | Red | NIR | |
| mean | 0.111 | 0.144 | 0.174 | 0.128 |
| standard deviation | 0.004 | 0.004 | 0.009 | 0.046 |
We then estimated the coefficient of variation (CV, in percentage) of the mud for each band. For example, in the case of the blue band:
CVB = 100 × σB B (1)
where CVB is the coefficient of variation of the mud for the blue band (%), σB is the standard deviation of the mud in the blue band, and B its mean value.
To estimate the similarity of a given pixel to the spectral characteristics of the mud, we estimated for each pixel the ratio (T, in percentage) between its reflectivity in a given band and the mean reflectivity of the mud in the same band. For example, in the case of the red band:
TR(i,j) = 100 × R(i,j) R (2)
where TR(i, j) is the ratio value in the red band for the pixel at coordinates i, j; R(i, j) the reflectivity in the red band for pixel at coordinates i, j; and R the mean reflectivity of the mud on the red band.
We then estimated at each pixel the mean (T(i,j)) and standard deviation of this ratio for all three bands (σT(i,j)), and the corresponding coefficient of variation (CVT(i,j)):
CVT(i,j) = 100 × σT(i,j) T(i,j) (3)
We finally selected as a threshold for mud identification the average of the three coefficients of variation of the mud in the blue, green and red bands, multiplied by 3. This threshold has been selected under the assumption of a normal distribution of mud reflectivity in each band so that 99.7% of the distribution falls within 3 standard deviations of the mean. In our case this threshold is set at 11.5%: if CVT(i,j) is below this threshold, the pixel is labelled as mud; conversely, it is labelled as clear of mud.
However, this approach leads to a high number of false detections. As a matter of fact, any natural bare surface – usually earth – presents a similar spectrum as the mud. Therefore, we decided to compare the post-event mud mask to another one derived from data from before the flood event. To that end, we restricted our mud mask to the pixels for which the post-event pixel is labelled as mud and only if its CVT(i,j) value after the event is at least 25% lower than before the flood. With this restriction, we ensure that the spectral signature of the detected mud is closer to the reference spectrum of the mud after the event than before, excluding bare soils and muddy areas before the event. Finally, we applied an opening morphological filter to the obtained mud mask to remove isolated pixels.
We applied this approach on both T30SXJ and T30SYJ tiles, which were then integrated as a mosaic. A province boundary mask was then applied to remove detections outside of the Valencia Province. The resulting mask has been overlaid over Google Maps and can be navigated through at www.uv.es/ucg/dana.html.
5. Results
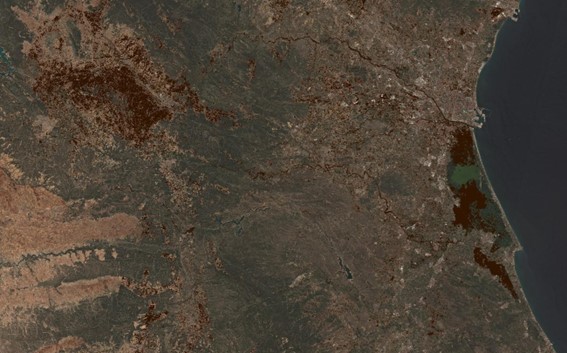
Figure 8 presents the obtained mud mask overlaid on the August 12, 2024 Sentinel-2 mosaic. In this figure, we see roughly two areas covered in mud. The first is located on the mainland, in the “Meseta de Utiel – Requena” area, where precipitations reached 165 mm on the 29th of October 2024 (AEMET, 2024), at 750m ASL, while the second is located on the coast, around the Albufera lagoon, at a few meters ASL. We can also identify clearly the different riverbeds between both areas, as brown lines connecting them. The “Horta Sur” area, the most impacted area by the flash flood event, located south of the city of Valencia and north of the Albufera lagoon, does not appear fully brown on the map due to the discontinued character of the detected mud, with only small discontinuous patches of mud detected.
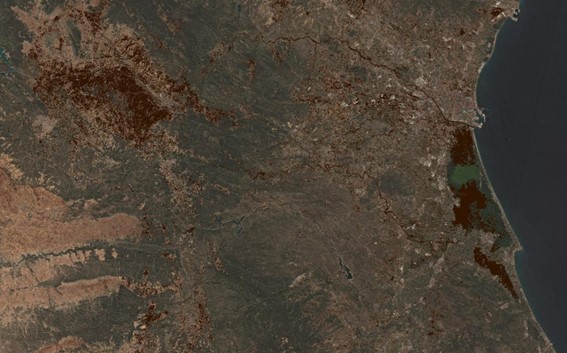 |
Figure 8. Final mud mask (in brown), after discrimination of false positives.
Figure 9 displays the flood mask provided by the Faculty of Geography of the University of Valencia. This flood mask differs greatly from the mud mask presented in Figure 6. Only riverbeds show as flooded in the inland “Meseta de Utiel-Requena” while the whole area shows as muddy. As for the coastal area, more areas appear as flooded, especially immediately south and west of Valencia, and in the area of Algemesi and Alzira (southern part of the figure). In this latter area, only the riverbeds appear as “muddy”.
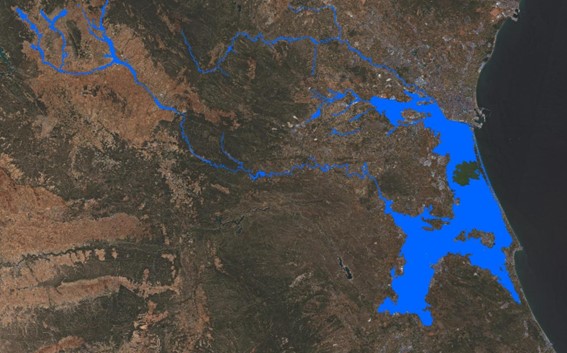 |
Figure 9. Flood mask (in blue) over the same area as Figure 8.
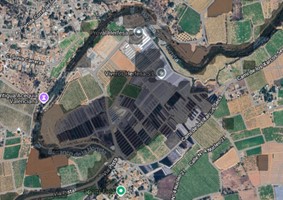
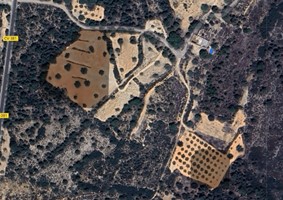
Figure 10 presents a close-up of the Google Maps visor for validation points 1 to 3. In the first case, we see an adequate mapping of the mud, with a delimitation following closely the observations carried out in situ by author J.A.S. The water invaded most of the nursery, destroying most of the fields within the river bend, while the northern part of the plantation (outside of the bend) was little impacted. In the second case, the inhabitants reported and filmed running water throughout their property (personal communication to Y.J., October 30, 2024). However, mud is not detected for most of the neighborhood, except in two areas with lower tree cover. As for our third validation point, the area was observed as muddy by author J.A.S. on November 10, 2024. Our algorithm accurately detects the mud in this area, even though not all fields are labelled as muddy.
 |  |
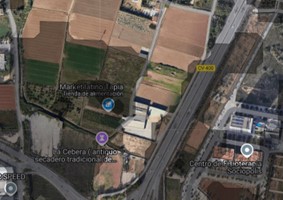 |
Figure 10. Detected mud (brown layer) at Validation Points 1 to 3, from left to right and up to bottom.
6. Discussion
Despite known limitations, we deem that our approach is useful for early assessment of damages, especially in rural areas, where low inhabitant density makes it more complicated to retrieve information. Its simplicity allows for rapid product availability: we estimate that image selection, downloading, and processing should take no longer than two hours. Moreover, in the case of floods, depending on the satellite overpass schedule, permanency of water at image acquisition is not guaranteed. However, the mud remains longer and can be satisfactorily mapped as shown before. In the case of Valencia, having access to such data in the afternoon of October 31st would have been of immense value, since the first related data took one week to become available.
Concerning limitations, the most obvious one is the presence of clouds, which are common before, during and after an extreme precipitation event. In our case, we updated our mud mask with every newly available S2 MSI image until November 10, when the cloud cover over the study area was negligible. Another limitation is the size of Sentinel-2 MSI pixel (10 meters by 10 meters), which does not allow for an adequate mapping of the mud inside the urban areas, where the material and personal damage has been more important. Indeed, for our method to identify mud correctly, the pixel must be homogeneous, which is not often the case. Therefore, if tree canopies, rooftops or other elevated artificial surfaces are included in a given pixel, it will not be labelled as muddy, even though it has been entirely flooded at ground level. It will lead to numerous omissions of muddy areas. Moreover, the mud spectral signature is close to the earth spectral signature in some areas. Even though our comparison with maps from before the flood event lowers the risk of confusion, it still exists, and it is difficult to quantify with the present spatial resolution.
Another important aspect of our approach is the choice of the reference data used. This reference data was utilized to check if the spectral signature of the detected mud is closer to the reference mud spectral signature after than before the flood event. In our area, only two reasonably clear S2 MSI images were available during the 3 months previous to the flood. The closest in terms of time is from the end of September/beginning of October 2024, a few weeks before the rainy event. However, it presents two cumulus clouds, as well as light cirrus that complicate the surface detection. We therefore opted for a cloud-free image from August 12th, 2024, three months before the rain event. Due to the time lag between our reference and post-event observations, changes in land use, especially agricultural practices such as tilling, might be introducing false identifications as mud areas. Also, other storms or rain events occurred before the time of the flooding, and it may have led to the presence of mud in non-flooded areas.
Finally, the lack of centralized data for validation remains a major limitation at the time of writing. Currently, no definitive mapping of the affected area is available, nor has an inventory of impacted agricultural zones been compiled. This significantly hampers the validation of our approach and precludes the use of quantitative metrics such as the Kappa index or confusion matrix. Consequently, we opted for the qualitative validation approach described above. In 2025, a new digital product developed by a research team from the Polytechnic University of Valencia (UPV) provides a detailed, street-level flood map for the municipalities of l’Horta Sud—one of the regions impacted by the flood. This work is based on field measurements conducted in November and December 2024 and February 2025, and it presents preliminary data (as of 28/02/2025) on the water levels reached (in meters). Further analysis comparing our mud map with this product could offer a valuable opportunity for post hoc validation and refinement of our methodology.
7. Conclusions
In this work we have presented a simple but effective approach to map mud in the aftermath of the dramatic flash floods of Valencia on October 29 2024. This approach relies on the identification of pure mud pixels in Sentinel-2 MSI data, from which mud reference spectral characteristics are derived. Then the rest of the image is tested for similarity with this spectral reference and compared with a pre-event acquisition to ensure that these spectral characteristics are closer to mud after the event. In the absence of centralized validation data, we have carried out a qualitative validation which shows that this method performs satisfactorily under given conditions. These conditions are the availability of a recent cloud-free pre-event image, as well as a large homogeneity of the considered muddy pixel. This method cannot be applied where trees or roofs are present and therefore is more useful in the countryside than in cities.
This method can be easily translated to other locations, provided an adequate choice of the reference spectral characteristics of the mud or other material to detect in the image. We plan to apply this method to future events, with the aim of rapid processing of the available data to provide both policy makers and the wide public with much-needed information in the aftermath of such catastrophic events.
Author Contributions
Conceptualization: YJ, ABR, CZG; Data curation: YJ, ABR, CZG; Formal analysis: YJ, ABR, CZG; Funding acquisition: JAS; Investigation: YJ, JAS, ABR, CZG, JSL; Methodology: YJ, ABR, CZG, JSL; Project administration: JAS; Resources: JAS; Software: YJ; Supervision: JAS; Validation: YJ, JAS, ABR, CZG, JSL; Visualization: YJ, CZG; Writing – original draft: YJ, ABR, CZG, JSL; Writing – review & editing: YJ, JAS, ABR, CZG, JSL.
Declaration of competing interest
The authors declare that they have no known competing financial interests or personal relationships that could have appeared to influence the work reported in this paper.
Acknowledgements
This work has been done thanks to the availability of Copenicus-ESA data and services. We also thank Tracasa Global and the several citizens that have dedicated resources and time to provide data and information of high quality.
Funding
This research was funded by the Conselleria de Educacion, Cultura, Universidades y Empleo, Generalitat Valenciana, within the PROMETEO 2024 framework (Subvenciones para la realizaciones de proyectos de I+D+I para grupos de investigación de excelencia), under the project “Indicadores Medioambientales y Fenómenos Adversos en la Comunidad Valenciana usando datos de satélite” (INMESAT, referencia CIPROM2023-42) and by MICIN/AEI/10.13039/501100011033 and FEDER, UE (project PID2024- 156170OB-C33).
References
AEMET (2024). https://x-y.es/aemet/est-8309X-utiel-la-cubera?fecha=2024-10-29, last accessed December 18, 2024.
Bull, L. J., M.J Kirkby, J Shannon, J.M Hooke, The impact of rainstorms on floods in ephemeral channels in southeast Spain, CATENA, Volume 38, Issue 3, 2000, Pages 191-209, ISSN 0341-8162, https://doi.org/10.1016/S0341-8162(99)00071-5
Camarasa, A.M. and Tilford, K.A. (2002), Rainfall–runoff modelling of ephemeral streams in the Valencia region (eastern Spain). Hydrol. Process., 16: 3329-3344. https://doi.org/10.1002/hyp.1103
Camarasa-Belmonte A.M., Flash floods in Mediterranean ephemeral streams in Valencia Region (Spain), Journal of Hydrology, Volume 541, Part A, 2016, Pages 99-115, ISSN 0022-1694, https://doi.org/10.1016/j.jhydrol.2016.03.019
Camarasa-Belmonte, A.M. and Soriano-García, J. Flood risk assessment and mapping in peri-urban Mediterranean environments using hydrogeomorphology. Application to ephemeral streams in the Valencia region (eastern Spain), Landscape and Urban Planning, Volume 104, Issue 2, 2012, Pages 189-200, ISSN 0169-2046, https://doi.org/10.1016/j.landurbplan.2011.10.009
Cerdà, A. and Doerr, S.H. (2007), Soil wettability, runoff and erodibility of major dry-Mediterranean land use types on calcareous soils. Hydrol. Process., 21: 2325-2336. https://doi.org/10.1002/hyp.6755
CSIC (2024a) CSIC Press release: En las riadas no solo daña el agua, daña más el barro [Press release] https://www.csic.es/es/actualidad-del-csic/en-las-riadas-no-solo-dana-el-agua-dana-mas-el-barro, last accessed 15 May 2025
CSIC (2024b) CSIC Press release: El CSIC emplea con éxito materiales espesantes contra el lodo de los garajes para facilitar su extracción tras la DANA, https://www.csic.es/es/actualidad-del-csic/el-csic-emplea-con-exito-materiales-espesantes-contra-el-lodo-de-los-garajes-para-facilitar-su-extraccion-tras-la-dana, last accessed 15 May 2025
EFAS (2025). https://confluence.ecmwf.int/display/CEMS/European+Flood+Awareness+System, last accessed May 14, 2025
Jiang H, Feng M, Zhu Y et al (2014) An automated method for extracting rivers and lakes from landsat imagery. Remote Sens 6:5067–5089. https://doi:10.3390/rs6065067
MITECO (2024). https://www.miteco.gob.es/es/prensa/ultimas-noticias/2024/noviembre/octubre-de-2024-fue-el-mas-lluvioso-de-la-serie-historica.html#:~:text=Balance%20clim%C3%A1tico%20de%20AEMET&text=Una%20DANA%20provoc%C3%B3%20un%20episodio,de%20Espa%C3%B1a%20en%20ese%20per%C3%ADodo., last accessed December 18, 2024.
Rosser, J.F., Leibovici, D.G. & Jackson, M.J. Rapid flood inundation mapping using social media, remote sensing and topographic data. Nat Hazards 87, 103–120 (2017). https://doi.org/10.1007/s11069-017-2755-0
Sy B, Frischknecht C, Dao H, Consuegra D, Giuliani G. Reconstituting past flood events: the contribution of citizen science, Hydrology and Earth System Sciences vol. 24 issue 1 (2020) pp: 61-74 Yair, A., Raz-Yassif, N., 2004. Hydrological processes in a small arid catchment: scale effects of rainfall and slope length. Geomorphology 61, 155–169. https://doi.org/10.1016/j.geomorph.2003.12.003
Publisher’s Note
The statements, opinions, and data contained in all publications are solely those of the individual author(s) and contributor(s) and not of Recent Advances S.L. and/or the editor(s). Recent Advances S. L. and/or the editor(s) disclaim responsibility for any injury to people or property resulting from any ideas, methods, instructions, or products referred to in the content.