



Evapotranspiration anomalies over the Pantanal region during the 3 droughts 2018-2020
Vitor F. V. V. Miranda
1,2,Juan Carlos Jiménez

1, Isabel Trigo
2,3- Global Change Unit (GCU) of the Image Processing Laboratory (IPL), Universitat de València, C/ Catedrático José Beltrán 2, 46980 Paterna, Valencia, Spain.
- Earth Observation Unit, Portuguese Institute of Sea and Atmosphere, 1749-077 Lisbon, Portugal.
- Instituto Dom Luiz (IDL), University of Lisbon, Campo Grande, 1749-016, Lisbon, Portugal.

Abstract
The Pantanal region is the largest continuous wetland on Earth and one of the most biodiverse regions in the world. Its unique ecology relies on a natural flood pulse that sustains a great biodiversity. However, in the last decade, this region experienced anomalous temperatures, dryness and wildfires. In particular, Pantanal underwent three consecutive drought episodes during the years 2018, 2019 and 2020, which were analyzed in this study. In this paper we assess water and thermal stress conditions during these drought episodes using latent and sensible heat fluxes from reanalysis (ERA5land and FLDAS) as well as satellite LST and LAI products. Our results show a progressive intensification of soil moisture deficit, leading to high surface temperature amplitude (AMP-LST) anomalies, as actual evapotranspiration fails to match the evaporative demand. Drought conditions reached their maximum intensity in the September-October-November of 2020 season (SON-2020), when the combination of low soil moisture and high AMP-LST, associated to low Evaporative Fraction (EF), leads to thermal and water stress, further diminishing the ecosystem's capacity to recover from environmental disturbances. This study highlights the need for an integrated monitoring of land-atmosphere dynamics and the usefulness of satellite observations, with the aim to help and mitigate the impacts of extreme climatic events, such as drought episodes, over sensitive ecological areas, like Pantanal.Keywords
Land Surface Temperature, ERA5land, FLDAS, MODIS, Pantanal1. Introduction
The Pantanal, spanning approximately 140,000 square kilometers across Brazil, Bolivia, and Paraguay, is the largest continuous wetland on Earth and one of the most biodiverse regions in the world. Recognized as a UNESCO World Heritage site and Biosphere Reserve, it supports an extraordinary variety of flora and fauna, including several endangered species (Silva et al., 2024; Kumar et al., 2022). The dynamics of this ecosystem are shaped by seasonal floods, which transform the landscape and provide vital resources for species and communities. The Pantanal’s ecology relies heavily on this natural flood pulse, which reinforces nutrients and maintains habitats critical for species (both migratory or resident) and local community (Thielen et al., 2021).
In recent years, the region has become under severe environmental stress. The combined impacts of land-use change, agricultural expansion, and climatological changes in temperature and precipitation patterns have severely modified the region’s flood-drought cycle, increasing the likelihood and severity of wildfires, severe droughts and heat-waves (Lorenz et al., 2024; Libonati et al., 2022, Marengo et al., 2021). The drought that began at the end of 2018 marks one of the most significant climate-induced challenges in recent history, triggering a chain of extreme weather events, including high temperatures and a multi-year water deficit (Marengo et al., 2021, Costa et al., 2023). Together, these extreme conditions have not only reduced water availability but have also intensified fire risk, with 2020 recording some of the most destructive fires in the Pantanal’s history (Wantzen et al., 2024). The catastrophic fires of 2020, which burned approximately 30% of the Pantanal, were not isolated incidents; they were the result of compound climatic extreme events, where prolonged drought, persistent high temperatures, and reduced humidity contributed to exacerbate fire risks (Libonati et al., 2022).
A key factor in this disruption has been the significant soil moisture deficit observed throughout the Pantanal during these drought years. Soil moisture plays a crucial role in the region’s hydrological cycle, influencing vegetation health, evapotranspiration, and, ultimately, the flood pulse that defines the Pantanal’s ecosystem (Kumar et al., 2022, Thielen et al., 2021). The beginning of 2018 was characterized by precipitation shortage, which combined with prolonged periods of intense heat, has led to soil moisture depletion to levels well below historical norms (Libonati et al., 2022). This persistent moisture deficit has created conditions where plants experience water stress, leading to a reduction in productivity and resilience across vegetation types (Kumar et al., 2022).
The hydrological implications of such soil moisture anomalies extend well beyond vegetation health, fundamentally altering the land-atmosphere interactions. Under dry conditions, if soil water availability decreases beyond critical values, soil moisture becomes the primary variable controlling the partitioning of available energy into latent and sensible surface heat fluxes, with substantial consequences for both local and regional climates (Feldman et al., 2019; Dirmeyer et al., 2021). In the extreme case soil moisture falls below the wilting point, plants no longer can extract water from the soil and evapotranspiration is suppressed; in this case, even most of the available energy at the surface will be converted into sensible heat, resulting in elevated land surface temperatures (Dirmeyer et al., 2021; Panwar et al., 2019). Land-atmosphere coupling, i.e., conditions when soil moisture control surface fluxes and therefore near surface atmospheric variables, becomes especially pronounced under prolonged drought, as evidenced in various global regions experiencing severe heatwaves and soil drying (Dirmeyer et al., 2021; Kumar et al., 2022; Panwar et al., 2019).
In the Pantanal, this amplification effect has led to a marked increase in temperature and a decrease in precipitation and Soil Moisture, indicating a shift towards a more arid-like regime that could threaten the region’s unique flood-driven ecology (Silva et al., 2024, Libonati et al., 2022). Such interactions not only reinforce the persistence of dry conditions but also increase the risk of heat stress for vegetation, altering energy flux dynamics and compromising the Pantanal’s ecological resilience. As soil moisture continues to decline, the region’s vulnerability to prolonged droughts and the occurrence of wildfires is expected to grow, where the need for a comprehensive understanding of these land-atmospheric dynamics interactions becomes unprecedented.
This study focuses on the Pantanal’s environmental dynamics from 2018 to 2020, using energy flux measurements from reanalysis (i.e. ERA5land and FLDAS) and satellite data (i.e. MODIS products), to analyze the impacts of these climatic extremes on ecosystem processes. By examining this unique climatic and ecological disturbances period, this research aims to characterize the behavior and dynamics of the Pantanal under environmental stressors. Specifically, it seeks to identify patterns in climatic extremes that inform our understanding of system functioning. In this context, satellite-based observations provide a valuable reference for assessing the performance of reanalysis datasets, helping to highlight potential biases, such as the tendency of reanalysis to overestimate drought signals. Ultimately, the purpose of this work is to provide insights that support the development of sustainable management practices in the face of ongoing climate change.
2. Materials and Methods
2.1 Study area (Pantanal region)
The Pantanal is a vast and biodiverse wetland located mostly in the states of Mato Grosso and Mato Grosso do Sul in Brazil, though it also extends into Bolivia and Paraguay (Fig.1). The region ranges between 15°S to 24°S and between 55°W to 59°W, covering roughly 140,000 square kilometers. The Pantanal is considered the largest tropical wetland in the world and one of the most ecologically rich areas globally. It hosts an extraordinary variety of wildlife, including endangered species, such as jaguars, capybaras, giant otters, and the endangered hyacinth macaw. The region is governed by the annual flood pulse of the Paraguay River (Oliveira et al., 2000), which is fed by precipitation from the surrounding Brazilian Highlands The annual average precipitation in the region is approximately 1,400 mm, with interannual variability ranging from 800 to 1,600 mm, and occasionally reaching up to 2,000 mm in particularly wet years (Marcuzzo et al., 2011; Marengo et al., 2016, Marengo et al., 2021). During the rainy season, which typically lasts from October to March, rivers overflow, flooding up almost the entire region and creating vast seasonal lakes, marshes, and lagoons (Marengo et al., 2021). This cycle brings nutrient-rich sediments that support life. As water recedes in the dry season (from May to September), animals join around remaining water sources, creating high densities of biodiversity and opportunities for interaction between species (Junk et al., 2006). The Pantanal is also a critical area for local communities, where livelihoods rely on fishing and traditional practices.
2.2 Reanalysis
We have considered surface fluxes from two commonly used datasets, namely: FLDAS (McNally et al., 2017) and ERA5land (Muñoz-Sabater et al., 2021), both were selected based on their adequate spatial resolution (0.1º or higher) for the region. Data was acquired with a monthly temporal resolution from 2003-2021. We have also computed the Evaporative Fraction (EF) for the selected datasets, as the ratio between latent heat flux and net radiation. FLDAS is provided by the Land Data Assimilation System (LDAS), produced with the Noah Land Surface Model (NOAH-LSM), forced with the combination of the Modern-Era Retrospective analysis for Research and Applications version 2 (MERRA-2) (Bosilovich et al., 2015) data and Climate Hazards Group InfraRed Precipitation with Station data (CHIRPS) (Funk et al., 2015). ERA5-Land, on the other hand, is provided by the Copernicus Climate Change Service (C3S) and developed by the European Centre for Medium-Range Weather Forecasts (ECMWF). ERA5-Land is a downscaled land product based on the fifth generation of ECMWF reanalysis (ERA5, Hersbach et al., 2020), which integrates model data from the Integrated Forecasting System (IFS) with observations from satellite and in-situ measurements. ERA5land is produced at a high resolution of 9 km, providing a detailed global and regionally relevant dataset available from 1950 onwards. The inclusion of these two datasets allows for a robust comparison and more comprehensive understanding of surface flux variability in the Pantanal.
2.3 Satellite LST and LAI
To evaluate the performance of ERA5-Land and FLDAS, we used Land Surface Temperature (LST) data retrieved from satellite observations. Under clear sky conditions, satellite-derived LST, unlike reanalysis datasets, is calculated directly from thermal infrared radiance measurements at the top of the atmosphere, with corrections for atmospheric conditions and surface emissivity. As such, satellite LST serves as an observational dataset that does not rely on land surface models, which can provide relevant and independent information on the surface energy balance (Miranda et. al, 2024).
For this study, we have selected the MODIS LST product from the Aqua satellite (MYD21C3, Hulley et al., 2016), which offers monthly global LST at a 0.05º resolution. Acquired around 1:30 pm and 1:30 am, MODIS Aqua observations capture near-maximum and minimum daily LST values. The difference between daytime and nighttime LST was used here to compute the LST amplitude (AMP-LST), which serves as a valuable indicator of surface thermal dynamics. MODIS LST products are well-validated across diverse environments, with an accuracy of within 1K (Hulley et al., 2016; Li et al., 2020).
In addition to LST, we also selected Leaf Area Index (LAI) data to further analyze vegetation structure and its interactions with surface processes. LAI represents the total leaf per unit ground surface area and is a critical parameter for understanding land-atmosphere energy exchange. For this study, LAI data from the MODIS Terra and AQUA satellite (MCD15A2H, Myneni et al., 2015), available at a 500 m spatial resolution and an 8-day temporal resolution, was resample at monthly averages. LAI data also provides insights into vegetation health, complementing the thermal dynamics captured by LST.
2.4 Land Cover
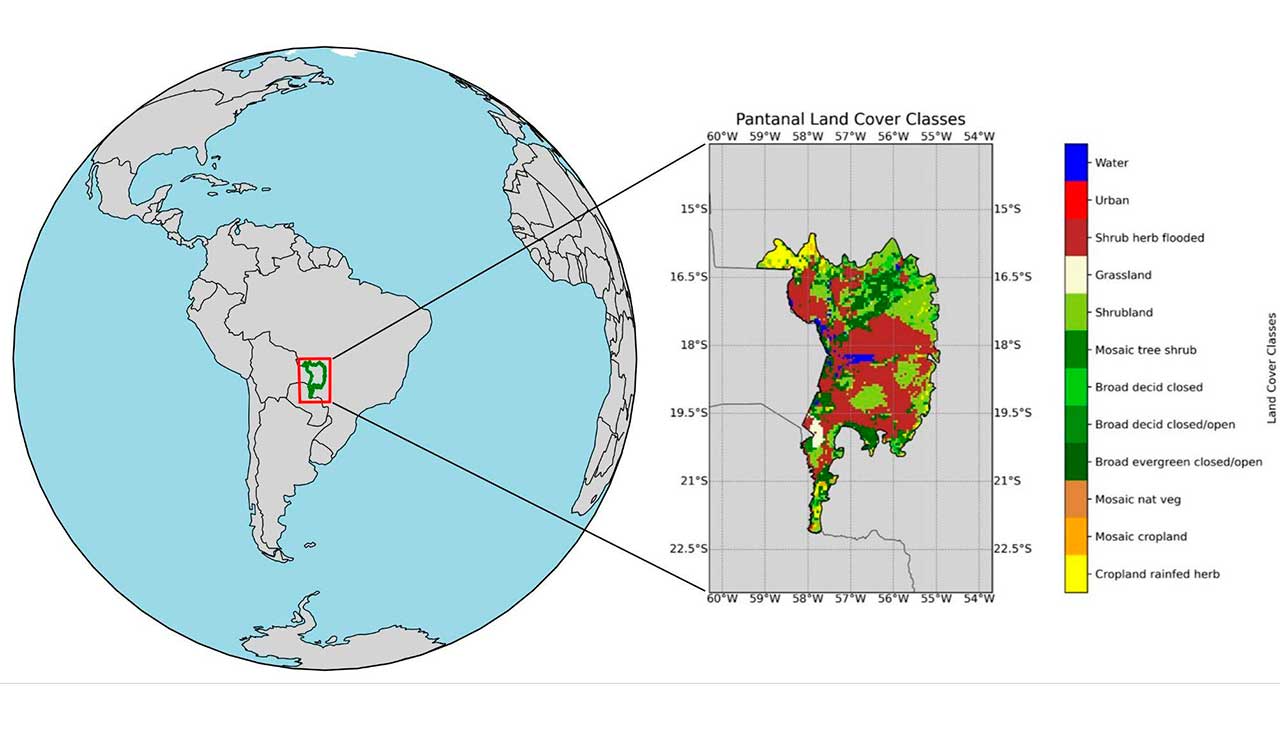
Pantanal can be characterized by a diverse mosaic of land cover types. Figure 1 shows the ESA Climate Change Initiative (ESA-CCI) land cover classification over the region (Defourny et al., 2014), for the year of 2020, derived from both combined remote sensing and in-situ observations. The original dataset provides land cover maps at a 300-meter spatial resolution, displaying 22 dominant land cover classes type per grid box. For this study, the data were interpolated to a common spatial resolution of 0.05º, assigning the most frequent classes to each grid. The dataset is publicly available at the CCI Land Cover viewer: https://maps.elie.ucl.ac.be/CCI/viewer/index.php. The most frequent classes are shrub and herbaceous flooded (Shrub herb flooded) with 42.35% of the region and shrubland with 27.43%, which provide critical habitats for grazing species and diverse fauna. Wetlands and water bodies, including marshes, lakes, and rivers, constitute a significant portion of the landscape (i.e. 1.94% of the region), supporting aquatic biodiversity. Forested areas are found along rivers and transition zones between wetlands and upland areas, hosting a variety of tree species and a considered portion of the region (i.e. 14.82 of broadleaved evergreen forest closed to open, 2.13% of broadleaved deciduous closed to open and 2.54% of mosaics of trees and shrub). Additionally, savanna-like areas such as Grassland (1.22%) or Mosaic Natural Vegetation (Mosaic nat veg, 0.14%), occur in less, but yet resembling the neighboring of the Cerrado biome. Mosaic cropland (0.93%) and Cropland rainfed herbaceous (5.53%) are classes directly linked with human activities, but yet with limited agricultural use. This unique interplay between terrestrial and aquatic ecosystems underpins the Pantanal’s ecological significance, supporting exceptional biodiversity and contributing to regional hydrology and land-atmosphere dynamics.
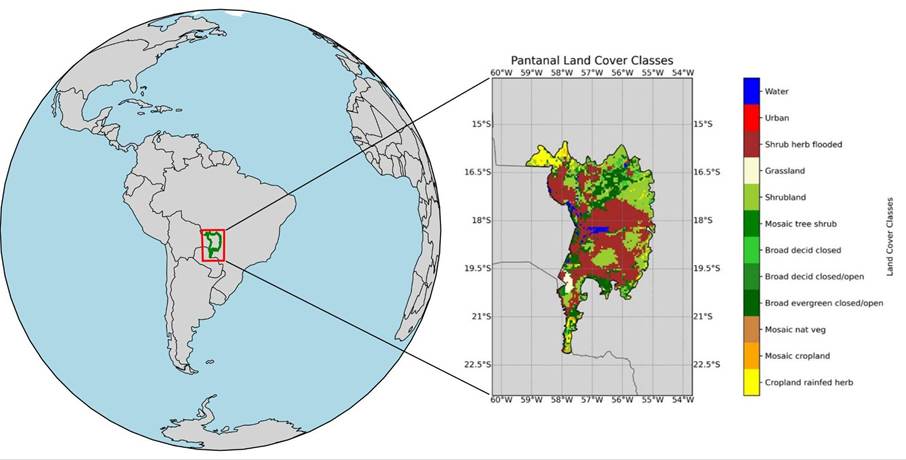
Figure 1: Land cover classes over the Pantanal region. The main land cover classes of the classification are: water bodies (Water); urban areas (Urban); shrub or herbaceous cover, flooded (Shrub herb flooded); grassland (Grassland); shrubland (Shrubland); Mosaic Tree and shrub (>50%) / herbaceous cover (<50%) (Mosaid tree shrub); tree cover, broadleaved, evergreen, closed to open (>15%) (Broad evergreen closed/open); tree broadleaved deciduous closed to open (Broad decid closed/open); Tree cover, broadleaved, deciduous, closed to open (>15%) (Broad decid closed); mosaic cropland (>50%) / natural vegetation (Tree, shrub, herbaceous cover) (<50%) (Mosaic cropland) and cropland rainfed herbaceous cover (Cropland rainfed herb).
2.5 Seasonal Anomalies
To explore the spatiotemporal variability of hydroclimatic and surface energy fluxes, we computed standardized anomalies for key variables, including Precipitation (Prec), Soil Moisture (SM), Surface Downwelling Solar Radiation (Rs), Net Radiation (Rn), Latent Heat flux (LE), Sensible Heat flux (H), Land Surface Temperature Amplitude (AMP-LST), Daily Land Surface Temperature (DAY-LST) and the Leaf Area Index (LAI). Standardized anomalies (astd) were calculated for each grid point using the following equation 1:
![\[ a_{std} = \frac{x_i - \mu}{\delta} \]](https://www.recentadvancesin.com/wp-content/ql-cache/quicklatex.com-3a8d9a5348629353d67ac1ee284e97c9_l3.png "Rendered by QuickLaTeX.com")
Where xi represents the monthly value at time i, μ is the mean, and σ is the standard deviation computed over the 2003–2021 reference period. Additionally, we have assumed that anomalies in DAY-LST as indicative of heat stress, while AMP-LST, given its relation with the energy partitioning into latent and sensible heat fluxes, may be sensitive to water stress conditions (Seneviratne et al, 2004; Seneviratne et al., 2010; Donat et al., 2017; Panwar et al., 2019; Feldman et al., 2019; Dirmeyer et al., 2021; Orth, 2021; Garcia-Garcia et al., 2023); furthermore, we look for signs of water stress when strong signatures are present both in AMP-LST and in LAI (i.e., we see signs of vegetation stress) – similar rationale has been followed for other satellite based indices (Bento et al., 2020). The heat and water stress indicators presented here were therefore computed based on the satellite data, where we considered regions under heat stress when the anomaly of the daily Land Surface Temperature (DAY-LST) was above 1K, while regions where the amplitude of land surface temperature (AMP-LST) was above 1K and also the Leaf Area Index (LAI) was below -1 m2/m2 were classified as being under water stressed
We also computed the Evaporative Fraction (EF) to assess the partitioning of available energy at the surface. EF illustrates the proportion of available energy (i.e., Rn – G) used for latent heat, providing a useful indicator of surface moisture availability and vegetation water stress. Although the EF may be computed as the ratio of LE to the sum of LE and H, or to net radiation (Rn), the values are nearly identical since the ground flux (G) at seasonal time-scales is very small. Here we have computed EF as LE divided by Rn. As such, EF complements our interpretation of AMP-LST and DAY-LST anomalies, offering additional insight into the mechanisms underlying land–atmosphere interactions during drought conditions.
3. Results
In order to analyze the sequence of drought episodes that occurred in the 2018-2020 period, we first consider sequences of December-January-February (DJF) and September-October-November (SON) seasons (i.e., covering the dry to wet and rainy period of the year in the region, respectively), between 2018 and 2020, which agree with the most expressive drought conditions as presented in Marengo et al., (2021). Figs. 2 and 3 exhibit the standardized anomaly maps of precipitation (Prec), soil moisture (SM), surface downwelling solar radiation (Rs), net radiation (Rn), latent heat flux (LE), and sensible heat flux (H) computed using the 2003–2021 reference period: Figure 2 shows the DJF seasons, i.e. 2018 (first and second row), 2019 (third and fourth), and 2020 (fifth and six), with ERA5-Land and FLDAS data for each variable; Fig. 3 shows the same as Fig, 2, but for SON seasons instead.
In DJF-2018 (i.e., December 2017 – to – February 2018), the Prec standardized anomaly maps indicate strong negative values, suggesting a significant reduction in rainfall and also the onset of the drought. As expected, SM is slightly negative, inertially responding to the precipitation negative values, suggesting a subtle decrease in water availability in the south of the region for both ERA5 and FLDAS datasets. Rs and Rn anomalies are strongly positive, reflecting the low cloud cover, while LE anomalies appear to follow SM, where negative values (blue) can be observed in the same low soil moisture regions. In the opposite direction, H anomalies show positive values (red) in regions where there is low soil-moisture.
Although the drought was already ongoing by the DJF-2019 season, with negative SM anomalies below 1 or even 1.5 standard deviation in both FLDAS and ERA5land datasets, Prec anomalies show slightly negative (way less pronounced than in 2018-DJF). Indeed, SM anomalies exhibit a strong decline reflecting the incapability to recover from the reduced rainfall in the previous rainy seasons. Neutral values in Rs and Rn are found for this period, reflecting more cloud coverage when compared to the previous year (also shown in the weak anomaly for Prec). Both LE and H follow SM, where increased blue values for LE and red values for H indicate a reduction in evapotranspiration, likely due to moderate soil moisture stress, and an increased heat stress, related to H. The DJF-2020 exhibits a strong difference among the datasets, where FLDAS heat flux anomalies are more pronounced in the north region, while ERA5land exhibits nearly spatially homogeneous over the whole region. Nevertheless, both datasets suggest a strong coupled relation between soil moisture anomalies and turbulent fluxes, with negative SM anomalies overlapping negative LE and positive H anomalies.
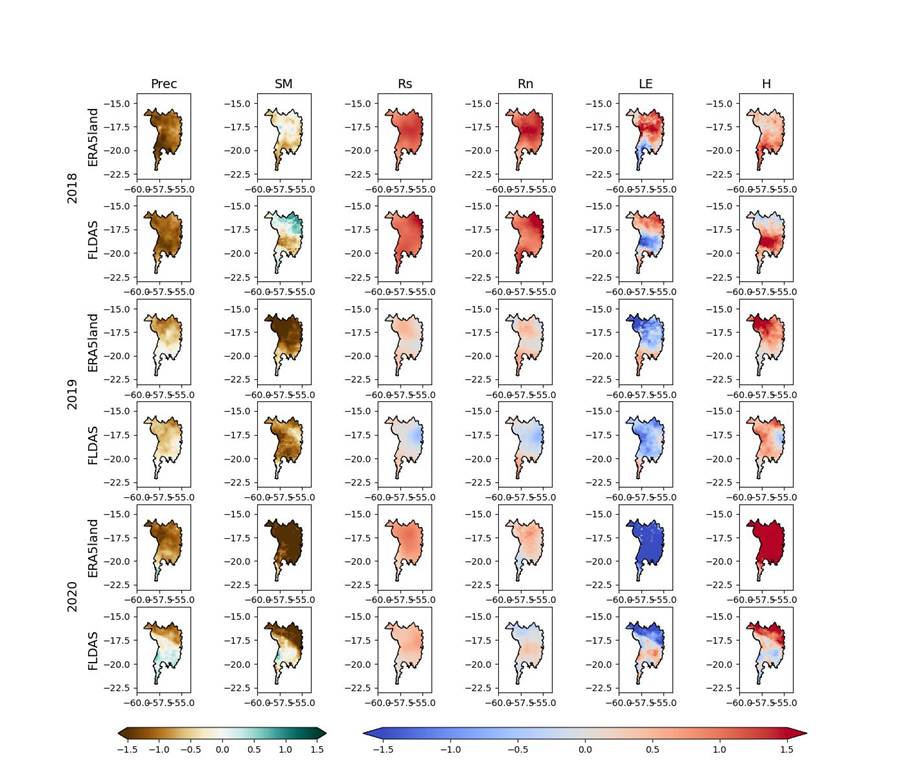
Figure 2: Standardized anomaly maps of precipitation (Prec), soil moisture (SM), surface downwelling solar radiation (Rs), net radiation (Rn), latent heat flux (LE), and sensible heat flux (H) for the DJF seasons, i.e. 2018 (first and second row), 2019 (third and fourth), and 2020 (fifth and six), with ERA5-Land and FLDAS data for each variable. The year refers to that of January and February and the previous December (e.g., DJF-2018 refers to the period between Dec 2017 and Feb 2018).
The most pronounced season of the drought occurred in 2020-SON (See Figures A1 and A2 in the Appendix section). In order to compare this season with other years, Figure 3 exhibits the standardized anomaly maps for SON between 2018 to 2020. In 2018-SON, the onset of the drought has not yet begun, as also disclosed in Marengo et al., (2021): Prec and SM anomalies are positive, indicating high water availability. Radiation anomalies are negative-to moderate, while the turbulent fluxes, LE (slightly positive) and H (negative), across most of the region do not show evidence of either water or heat stress. In 2019-SON (already in the drought period), both Prec and SM are negative, with neutral Rs and Rn, and negative LE and positive H (agreeing with the SM anomalies). 2020-SON is declared as the hot-spot of the drought, with the most intense conditions, but as in DJF season, there is a notable difference between the ERA5Land and FLDAS datasets. Prec anomalies appear stronger in ERA5 than FLDAS, signaling a significant reduction in rainfall, although both SM anomalies are markedly negative in ERA5-Land and FLDAS, indicating a clear water stress. Rs also appear with stronger increased values for ERA5 than FLDAS, while both reanalysis agree over the turbulent fluxes, showing weaker LE values all over Pantanal and stronger H. LE anomalies differ notably between datasets: ERA5-Land shows strong negative anomalies, indicating a substantial drop in evapotranspiration, while FLDAS reveals less intense negative anomalies, suggesting it retains some evaporative cooling capacity. Conversely, H anomalies are positive in both datasets, but ERA5-Land exhibits more pronounced positive values than FLDAS. ERA5-Land generally depicts a more severe response in terms of soil moisture deficit and excess radiation, while FLDAS suggests slightly less extreme conditions, though still representing an impactful drought event. This variability should be considered when interpreting the drought impacts on land surface temperature and energy balance in the Pantanal. The interannual variability can be observed in the standardized anomalies of spatial averages of latent heat flux (LE), sensible heat flux (H), soil-moisture (SM) and solar radiation (Rs), provided in the Appendix for all seasons, covering the period between March-April-May (MAM) of 2003 and December-January-February (DJF) of 2021 (See Figures A1 and A2 in the Appendix section).
Figure 3: As Fig. 2 instead the year refers to September, October and November (SON).
In order to capture a more realistic representation, and a better idea of heat and water stress over the region, Fig.4 shows products based on observations and independent from model assumptions, such as the Land Surface Temperature Amplitude (AMP-LST), the Daily Land Surface Temperature (DAY-LST) and the Leaf Area Index (LAI). The first three columns in Fig. 4 refer to DJF season, while the following 3 refer to SON season; the first row displays AMP-LST, the second shows DAY-LST and the third row shows LAI. The LST fields (both DAY-LST and AMP-LST) for 2018-DJF and 2019-DJF show moderate anomaly values, generally below 1K. In contrast, daytime LST and to a less extent AMP-LST show strong positive anomalies for 2020-DJF (above 1K and, in some areas, above 1.5K) clearly indicating wide-spread heat stress and most likely also water stress, considering that AMP-LST increases sharply when water availability limits the release of latent heat (Feldman et al., 2019; Miranda V. F. V. V. et. al, 2024; Panwar et al., 2019). 2020-DJF LAI reveals areas where negative anomalies start to emerge, especially towards the north region of Pantanal (i.e.where the most frequent land cover class is broadleaf evergreen forest closed to open). Comparing with the fields in Fig.2 for the same period (2020-DLF; two lower rows), we can observe that both datasets (i.e. ERA5land and FLDAS) seem to overestimate the patterns with respect to the satellite datasets: ERA5-land considers the whole Pantanal is already under stress, with homogeneous negative (positive) anomalies for Prec, SM and LE (Rs, Rn and H), while in FLDAS this is limited to the northeastern part of the region. In the case of SON seasons (i.e. the last three columns of Fig.4), the years of 2018 to 2020 are characterized by pronounced anomaly values. 2018-SON exhibit negative AMP-LST and DAY-LST anomalies, largely in agreement with positive LE obtained in both datasets shown in Fig.3 (first and second rows), while 2019-SON show pronounced negative DAY-LST anomalies in the southern region of Pantanal, which in turn agree well with the enhanced H as depicted by FLDAS and also ERA5land (see Fig.3 last column, third and fourth row). The last column of Fig.4 (2020-SON) accounts for the most outstanding signals, where AMP-LST and DAY-LST exhibit strong positive anomaly values and LAI strong negative anomaly values, indicating both heat and water stress leading to vegetation stress. If we compare those with the reanalysis (Fig.3 last 2 rows), we can see that heat and water stress conditions are apparent in both, but more strongly in the case of ERA5land (strong low SM and LE. strong high Rs and H). It is worth noting that the ERA5land fields show stronger and more spatially homogeneous signals for all variables when compared to FLDAS.
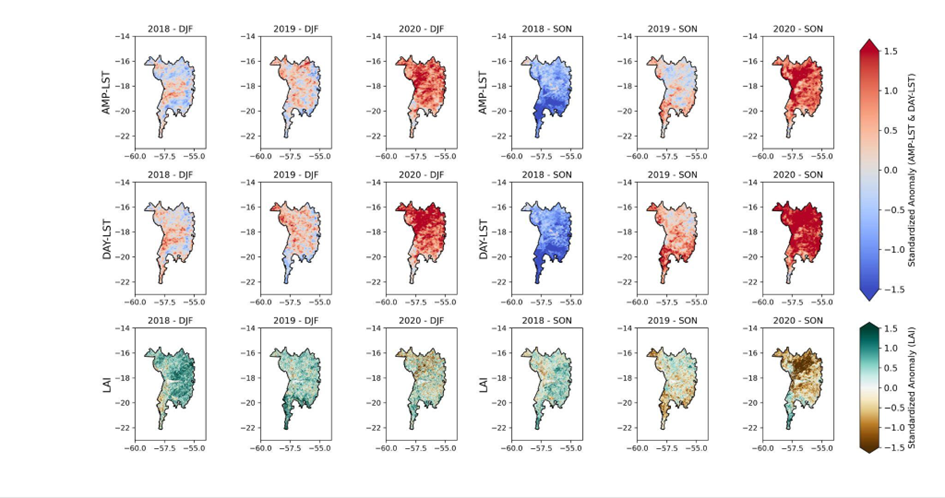
Figure 4: Land Surface Temperature Amplitude (AMP-LST, first row, in K), Daily Land Surface Temperature (DAY-LST, second row, in K) and the Leaf Area Index (LAI, third row in m2/m2). The first three columns refer to December, January, February season (DJF, where December is related to the previous year, e.g. 2018-DJF refers to the period between December of 2017 to February of 2018 ), while the following 3 refer to the September, October, November (SON) season.
Figure 5 presents the evaporative fraction maps for ERA5-Land and FLDAS datasets (first and second columns) and two considered classifiers named heat and water stress (last column). For 2018-DJF the Evaporative Fraction datasets present values above 0.6. Nevertheless, it is interesting to note that FLDAS EF shows a few spots with lower EF, which roughly overlap with a few scattered regions indicating heat stress; the satellite datasets do not show, however, generalized signs of heat stress and no indication of water stress. DJF-2019 reveals a marked decrease in EF with values below 0.4 for most of the region in the case of FLDAS; in the case of ERA5land, EF is also lower in 2019-DJF, but most regions are below 0.6. As in 2018-DJF, the satellite datasets show a few spots of heat stress, but still with no water stress significant indicators. The reanalysis showed strong signs of drought conditions in 2020-DJF, generalized EF values below 0.4. In this case, satellite observations suggest a very strong pattern for heat stress and a few localized areas showing signs of water stress. SON seasons are closely related to DJFs, but now clear differences emerge between ERA5land and FLDAS datasets. In 2018-SON, although the satellite datasets do not show any clear signatures of heat or water stress, FLDAS shows areas with EF below 0.4; such low values are not seen in ERA5land, although in this case EF is kept between 0.4 and 0.6 over most of the region. For 2019-SON FLDAS exhibits lower EF (lower than 0.4 and even 0.2) in the southern region of Pantanal, and in ERA5land these remain mostly higher than 0.4. According to our satellite indicators, heat stress starts to emerge in the southern region of Pantanal. 2020-SON is the most intense period, where both datasets indicate stress (low EF values) to the northern part of Pantanal, although, as before, FLDAS EF values are generally lower than those computed with ERA5land fields. In this case, the satellite indicators identify vast areas under heat stress and part of the northern Pantanal under water stress.
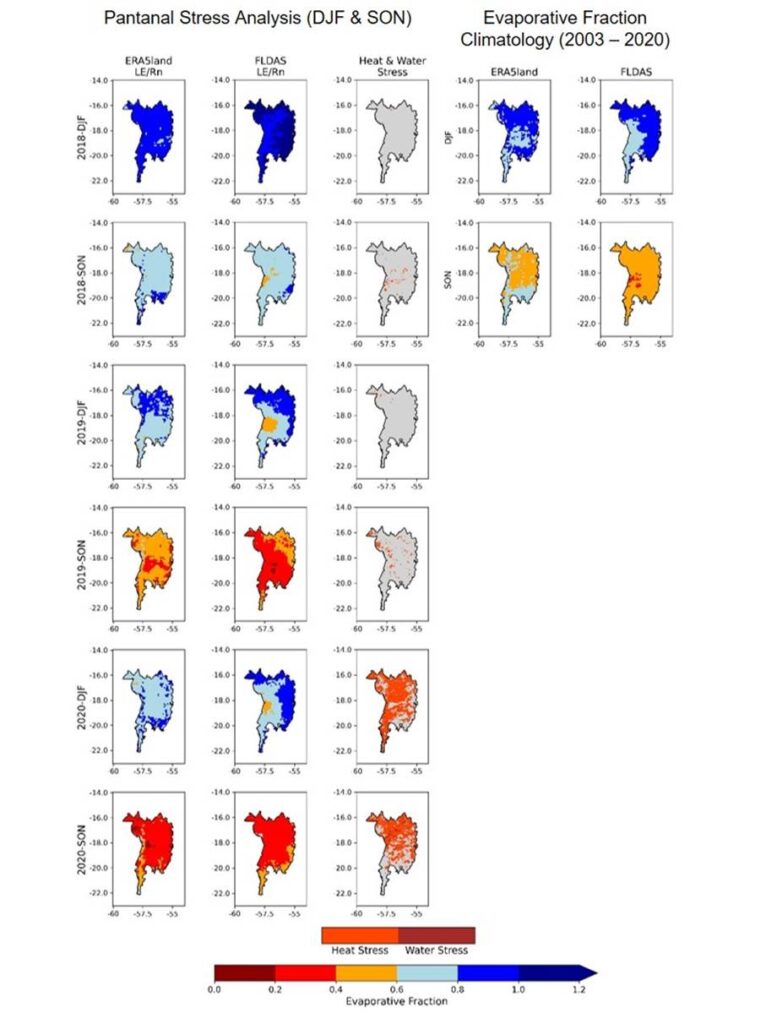
Figure 5: Evaporative fraction maps for ERA5-Land and FLDAS datasets (first and second columns), water stress classification (third column) and the climatological evaporative fraction for the studied seasons (according to ERA5-Land and FLDAS in the fourth and fifth columns, respectively). Heat stress is based on the DAY-LST anomaly, while water stress is based on both AMP-LST and LAI anomalies.
4. Discussion
The results presented here, provide a detailed view of how the Pantanal’s surface energy balance and related variables, such as land surface temperature amplitude (AMP-LST) dynamics have been affected by episodic droughts from 2018 to 2020. This analysis reveals patterns of severe drought-induced stress, driven by reduced precipitation and enhanced solar radiation, which have led to sharp decreases in soil moisture and a shift in energy flux partitioning, which in turn have profound implications for the Pantanal’s unique wetland ecosystem and its resilience, face future climate variability and changes. Prolonged droughts may lead to a decrease in water availability, affecting the region’s flood-pulse dynamics and reducing the habitat quality for species that depend on wetlands, also intensifying the occurrence of wildfires due to higher land surface temperatures and lower soil moisture, thus jeopardizing both vegetation health and biodiversity. Additionally, the capacity of the ecosystem to mitigate extreme weather conditions, such as heatwaves, may diminish due to the loss of natural water reservoirs and disrupted land-atmosphere feedback loops
Figures 2 and 3 show the impact of this drought on key hydrometeorological variables, including soil moisture and latent heat flux, which have sustained negative anomalies for all seasons and years considered in this study, particularly in 2020-SON. The reduction in soil moisture has further implications for energy balance: the negative LE anomalies and positive H anomalies across all drought periods confirm that low soil moisture has limited evaporation and increased sensible heating, resulting in higher AMP-LST. This energy partitioning mechanism is often referred to as “land-atmosphere coupling” (Dirmeyer et al., 2021; Panwar et al., 2019, Denissen et al., 2022), and it has become particularly pronounced under prolonged droughts. The results in Figure 4 illustrate this coupling effect, where reduced LE and increased H (controlled by SM) drive elevated AMP-LST, creating feedback loops that exacerbate drought conditions. This amplification of land surface temperature under drought stress aligns with observations in other regions experiencing severe heatwaves and soil drying (Dirmeyer et al., 2021; Kumar et al., 2022). AMP-LST amplitude anomalies for 2018-DJF, 2019-DJF, and 2020-SON suggest a substantial warming effect likely driven by reduced moisture availability and limited evaporative cooling. This intense warming is consistent with the reduction in soil moisture shown in Figure 4 and is further supported by Wantzen et al. (2024), who reported extreme temperatures and water deficits in 2020 that contributed to some of the most catastrophic fires in the Pantanal’s recent history. This warming effect, coupled with the drying conditions, increases vegetation heat stress, raising the risk of wildfires, a dynamic shown in other studies, linking severe droughts to wildfire outbreaks (Libonati et al., 2022, Marengo et al., 2021).
AMP-LST, DAY-LST and LAI anomalies are used here as water and heat stress classifications, providing a different perspective from satellite observations, considering the differences in the representation of the land-atmosphere interface under varying moisture conditions, among reanalysis. These discrepancies underscore variability in model representations of drought severity and energy partitioning under extreme conditions, further emphasizing the value of combining reanalysis and remote sensing data to capture a more complete picture of land-surface responses. Several factors contribute to the discrepancies between the ERA5-Land and FLDAS datasets, primarily stemming from differences in their underlying algorithms, spatial resolutions, and data inputs. ERA5-Land, which operates at a coarser resolution, assimilates a broader range of meteorological data, enabling it to capture large-scale atmospheric processes. In contrast, FLDAS, with its finer spatial resolution, incorporates distinct input data and utilizes different modeling approaches, leading to variations in key variables such as soil moisture, latent heat flux, and land surface temperature. These disparities underscore the importance of integrating both datasets to obtain a comprehensive understanding of drought impacts on the Pantanal.
The role of soil moisture in regulating surface temperatures via its control on surface energy dynamics is clear. This has been highlighted by Feldman et al., (2019) and Dirmeyer et al., (2021), who showed that a decline in Evaporative Fraction (EF) leads to increased sensible heat and elevated surface temperatures. As outstanded by Marengo et al., (2021) the strongest impact of the drought took place in 2020-SON, with clear signs of heat and water stress levels in all variables considered in this study, both provided by reanalysis and satellite observations.
These results are particularly concerning for the Pantanal’s ecological resilience, as prolonged soil moisture deficits threaten to shift the region toward a more arid-like climate regime. Such a shift could undermine the flood-pulse of the Pantanal, which relies on regular water availability to maintain habitat integrity and species diversity (Silva et al., 2024, Libonati et al., 2022). Additionally, if the frequency of these events increases, leading to sustained decline in soil moisture, vegetation health and productivity will be compromised, further increasing the risk of heat stress and wildfires. Such ongoing trends (Silva et al., 2024) highlight the need for a comprehensive understanding of land-atmosphere dynamics, especially as climate-induced droughts become more frequent and severe.
Additionally, in regions like the Pantanal, where the density of meteorological stations is low, the accuracy of climate data estimates can be significantly compromised. Limited ground observations increase the likelihood of both estimation and interpretation errors, particularly for variables such as precipitation, evapotranspiration, soil moisture, among others that can clearly influence the interpretation of drought intensity and duration. Moreover, the occurrence of atmospheric blockings can further complicate assessments by inducing prolonged dry periods, leading to substantial deviations in both reanalysis and observational datasets. These conditions introduce potential biases in drought characterization and highlight the need for caution when interpreting data in such contexts. To improve the robustness of drought assessments, it is essential to integrate multiple sources of information, including reanalysis data, satellite observations, and the available local measurements. It is also worth noting that the Pantanal has experienced continued drought events even after the 2018–2020 period examined in this study, emphasizing the urgency of enhancing monitoring capabilities and understanding drought dynamics in this ecologically sensitive region.
5. Conclusions
Three episodic droughts occurred consecutively outside of the typical dry season in the Pantanal wetland, each one presenting distinct impacts on land surface temperature amplitude (AMP-LST) and evaporative fraction (EF). During the first drought period analysed here (2018-DJF), there is a mild response in AMP-LST but no notable change in EF, suggesting that the land surface retained enough moisture to sustain evapotranspiration. In the second drought (2019-DJF), there is a pronounced increase in AMP-LST and high surface temperatures. Nevertheless, EF remains relatively stable, pointing to a continued but limited capacity for evaporative cooling. By the third drought season (2020-SON), both AMP-LST and EF exhibit strong signals, reflecting a critical depletion of soil moisture reserves and a significant reduction in evaporative fraction. This shift in energy fluxes, where sensible heat increases due to insufficient latent heat in response to the atmosphere evaporative demand, underscores the cumulative impact of repeated droughts on the region’s hydrometeorological processes. Ultimately, this leads to thermal and water stress and diminished ecosystem resilience. Notably, the occurrence of more recent drought events, such as the severe dry conditions in 2021 and beyond, further highlights the Pantanal’s vulnerability to consecutive and atypical droughts. These events reinforce the urgent need to address the ongoing risks posed by climate variability.
These observations emphasize the vulnerability of the Pantanal to consecutive droughts, particularly outside the dry season, and underscore the potential long-term impacts on local climate dynamics and biodiversity. Future work should try to integrate high-resolution remote sensing data and in-situ measurements to enhance the spatial and temporal understanding of AMP-LST, DAY-LST, LAI and EF dynamics, offering insights into hydrological and microclimatic variations within the Pantanal region. Developing predictive models that incorporate these variables could help to anticipate future drought events and their potential impacts, facilitating early warning systems and informing adaptive management strategies. Finally, exploring ecosystem responses, such as shifts in species distribution and changes in biodiversity, would provide a holistic view of the environmental consequences, contributing to sustainable conservation and climate adaptation efforts in the region.
Author Contributions
Vitor F. V. V. de Miranda: Conceptualization, Methodology, Software
and Algorithms, Data extraction, Data Analysis, Writing original draft and
Editing. J. C. Jimenez: Conceptualization, Analysis, Writing-Reviewing
and Editing. I. F. Trigo: Conceptualization, Methodology, Analysis, Writing-
Reviewing and Editing.
Declaration of competing interest
The authors declare that they have no known competing financial interests or personal relationships that could have appeared to influence the work reported in this paper.
Data availability
Data will be made available on request.
Acknowledgements
The authors thank the associate editor and the reviewers for their
systematic review and valuable comments.
Funding
This study was supported by the Land Surface Analysis Satellite Applications Facility LSA-SAF.
References
Bento, V. A., Gouveia, C. M., DaCamara, C. C., Libonati, R., & Trigo, I. F. (2020). The roles of NDVI and Land Surface Temperature when using the Vegetation Health Index over dry regions. Global and Planetary Change, 190. https://doi.org/10.1016/j.gloplacha.2020.103198
Bosilovich, M. G., Lucchesi, R., & Suarez, M. (2015). Global Modeling and Assimilation Office MERRA-2: File Specification. http://gmao.gsfc.nasa.gov/pubs/office_notes.
Calim Costa, M., Marengo, J. A., Alves, L. M., & Cunha, A. P. (2024). Multiscale analysis of drought, heatwaves, and compound events in the Brazilian Pantanal in 2019–2021. Theoretical and Applied Climatology, 155(1), 661–677. https://doi.org/10.1007/s00704-023-04655-2
Defourny, P., Boettcher, M., Bontemps, S., Kirches, G., Krueger, O., Lamarche, C., Lembrée, C., Radoux, J., & Verheggen, A. (2014). Algorithm theoretical basis document for land cover climate change initiative, Technical report. http://due.esrin.esa.int/page_globcover.php
Denissen, J. M. C., Teuling, A. J., Pitman, A. J., Koirala, S., Migliavacca, M., Li, W., Reichstein, M., Winkler, A. J., Zhan, C., & Orth, R. (2022). Widespread shift from ecosystem energy to water limitation with climate change. Nature Climate Change, 12(7), 677–684. https://doi.org/10.1038/s41558-022-01403-8
Dirmeyer, P. A., Balsamo, G., Blyth, E. M., Morrison, R., & Cooper, H. M. (2021). Land‐Atmosphere Interactions Exacerbated the Drought and Heatwave Over Northern Europe During Summer 2018. AGU Advances, 2(2). https://doi.org/10.1029/2020av000283
Divina De Oliveira, M., Débora, &, & Calheiros, F. (2000). Flood pulse influence on phytoplankton communities of the south Pantanal floodplain, Brazil. In Hydrobiologia (Vol. 427).
Donat, M. G., Pitman, A. J., & Seneviratne, S. I. (2017). Regional warming of hot extremes accelerated by surface energy fluxes. Geophysical Research Letters, 44(13), 7011–7019. https://doi.org/10.1002/2017GL073733
Feldman, A. F., Short Gianotti, D. J., Trigo, I. F., Salvucci, G. D., & Entekhabi, D. (2019). Satellite-Based Assessment of Land Surface Energy Partitioning–Soil Moisture Relationships and Effects of Confounding Variables. Water Resources Research, 55(12), 10657–10677. https://doi.org/10.1029/2019WR025874
Funk, C., Peterson, P., Landsfeld, M., Pedreros, D., Verdin, J., Shukla, S., Husak, G., Rowland, J., Harrison, L., Hoell, A., & Michaelsen, J. (2015). The climate hazards infrared precipitation with stations – A new environmental record for monitoring extremes. Scientific Data, 2. https://doi.org/10.1038/sdata.2015.66
García-García, A., Cuesta-Valero, F. J., Miralles, D. G., Mahecha, M. D., Quaas, J., Reichstein, M., Zscheischler, J., & Peng, J. (2023). Soil heat extremes can outpace air temperature extremes. Nature Climate Change, 13(11), 1237–1241. https://doi.org/10.1038/s41558-023-01812-3
Hersbach, H., Bell, B., Berrisford, P., Hirahara, S., Horányi, A., Muñoz-Sabater, J., Nicolas, J., Peubey, C., Radu, R., Schepers, D., Simmons, A., Soci, C., Abdalla, S., Abellan, X., Balsamo, G., Bechtold, P., Biavati, G., Bidlot, J., Bonavita, M., … Thépaut, J. N. (2020). The ERA5 global reanalysis. Quarterly Journal of the Royal Meteorological Society, 146(730), 1999–2049. https://doi.org/10.1002/qj.3803
Hulley, G., Malakar, N., & Freepartner, R. (2016). Moderate Resolution Imaging Spectroradiometer (MODIS) Land Surface Temperature and Emissivity Product (MxD21) Algorithm Theoretical Basis Document Collection 6.1.
Junk, W. J., da Cunha, C. N., Wantzen, K. M., Petermann, P., Strüssmann, C., Marques, M. I., & Adis, J. (2006). Biodiversity and its conservation in the Pantanal of Mato Grosso, Brazil. Aquatic Sciences, 68(3), 278–309. https://doi.org/10.1007/s00027-006-0851-4
Kumar, S., Getirana, A., Libonati, R., Hain, C., Mahanama, S., & Andela, N. (2022). Changes in land use enhance the sensitivity of tropical ecosystems to fire-climate extremes. Scientific Reports, 12(1). https://doi.org/10.1038/s41598-022-05130-0
Li, H., Li, R., Yang, Y., Cao, B., Bian, Z., Hu, T., Du, Y., Sun, L., & Liu, Q. (2021). Temperature-Based and Radiance-Based Validation of the Collection 6 MYD11 and MYD21 Land Surface Temperature Products over Barren Surfaces in Northwestern China. IEEE Transactions on Geoscience and Remote Sensing, 59(2), 1794–1807. https://doi.org/10.1109/TGRS.2020.2998945
Libonati, R., Geirinhas, J. o. L., Silva, P. S., Russo, A., Rodrigues, J. A., Belém, L. B. C., Nogueira, J., Roque, F. O., Dacamara, C. C., Nunes, A. M. B., Marengo, J. A., & Trigo, R. M. (2022). Assessing the role of compound drought and heatwave events on unprecedented 2020 wildfires in the Pantanal. Environmental Research Letters, 17(1). https://doi.org/10.1088/1748-9326/ac462e
Lorenz, C., Libonati, R., Coelho Belém, L. B., Oliveira, A., Chiaravalloti, R. M., Nunes, A. V., Luciano Batista, E. K., Fernandes, G. W., Chiaravalloti-Neto, F., Damasceno-Junior, G. A., Berlinck, C. N., & de Oliveira Roque, F. (2024). Historical association between respiratory diseases hospitalizations and fire occurrence in the Pantanal wetland, Brazil. Atmospheric Pollution Research, 15(8). https://doi.org/10.1016/j.apr.2024.102182
Marcuzzo, F. F. N., Rocha, H. M., and Melo, DCR. (2011). Mapeamento da precipitac,ão pluviométrica no bioma Pantanal do estado do Mato Grosso. Geoambiente On-line 16, 66–84.
Marengo, J. A., Alves, L. M., and Torres, RR. (2016). Regional climate change scenarios in the Brazilian Pantanal watershed. Clim Res. 68, 201–213. doi: 10.3354/cr01324
Marengo, J. A., Cunha, A. P., Cuartas, L. A., Deusdará Leal, K. R., Broedel, E., Seluchi, M. E., Michelin, C. M., de Praga Baião, C. F., Chuchón Ângulo, E., Almeida, E. K., Kazmierczak, M. L., Mateus, N. P. A., Silva, R. C., & Bender, F. (2021). Extreme Drought in the Brazilian Pantanal in 2019–2020: Characterization, Causes, and Impacts. Frontiers in Water, 3. https://doi.org/10.3389/frwa.2021.639204
McNally, A., Arsenault, K., Kumar, S., Shukla, S., Peterson, P., Wang, S., Funk, C., Peters-Lidard, C. D., & Verdin, J. P. (2017). A land data assimilation system for sub-Saharan Africa food and water security applications. Scientific Data, 4. https://doi.org/10.1038/sdata.2017.12
Miranda, V. F. V. V., Jimenez, J. C., Dutra, E., & Trigo, I. F. (2024). Consistency assessment of latent heat flux and observational datasets over the Amazon basin. Environmental Research Letters, 19(5). https://doi.org/10.1088/1748-9326/ad40c3
Muñoz-Sabater, J., Dutra, E., Agustí-Panareda, A., Albergel, C., Arduini, G., Balsamo, G., Boussetta, S., Choulga, M., Harrigan, S., Hersbach, H., Martens, B., Miralles, D. G., Piles, M., Rodríguez-Fernández, N. J., Zsoter, E., Buontempo, C., & Thépaut, J. N. (2021). ERA5-Land: A state-of-the-art global reanalysis dataset for land applications. Earth System Science Data, 13(9), 4349–4383. https://doi.org/10.5194/essd-13-4349-2021
Myneni, R., Knyazikhin, Y., & Park, T. (2021). MODIS/Terra+Aqua Leaf Area Index/FPAR 8-Day L4 Global 500m SIN Grid V061 [Data set]. NASA EOSDIS Land Processes Distributed Active Archive Center.
Orth, R. (2021). When the Land Surface Shifts Gears. AGU Advances, 2(2). https://doi.org/10.1029/2021av000414
Panwar, A., Kleidon, A., & Renner, M. (2019). Do Surface and Air Temperatures Contain Similar Imprints of Evaporative Conditions? Geophysical Research Letters, 46(7), 3802–3809. https://doi.org/10.1029/2019GL082248
Seneviratne, S. I., Corti, T., Davin, E. L., Hirschi, M., Jaeger, E. B., Lehner, I., Orlowsky, B., & Teuling, A. J. (2010). Investigating soil moisture-climate interactions in a changing climate: A review. In Earth-Science Reviews (Vol. 99, Issues 3–4, pp. 125–161). https://doi.org/10.1016/j.earscirev.2010.02.004
Seneviratne, S. I., Viterbo, P., Lüthi, D., Schär, C. (2003). Inferring Changes in Terrestrial Water Storage Using ERA-40 Reanalysis Data: The Mississippi River Basin.
Silva, P. S., Rodrigues, J. A., Nogueira, J., Moura, L. C., Enout, A., Cuiabália, C., DaCamara, C. C., Pereira, A. A., & Libonati, R. (2024). Joining forces to fight wildfires: Science and management in a protected area of Pantanal, Brazil. Environmental Science and Policy, 159. https://doi.org/10.1016/j.envsci.2024.103818
Thielen, D., Ramoni-Perazzi, P., Puche, M. L., Márquez, M., Quintero, J. I., Rojas, W., Soto-Werschitz, A., Thielen, K., Nunes, A., & Libonati, R. (2021). The pantanal under siege—on the origin, dynamics and forecast of the megadrought severely affecting the largest wetland in the world. Water (Switzerland), 13(21). https://doi.org/10.3390/w13213034
Wantzen, K. M., Assine, M. L., Bortolotto, I. M., Calheiros, D. F., Campos, Z., Catella, A. C., Chiaravalotti, R. M., Collischonn, W., Couto, E. G., da Cunha, C. N., Damasceno-Junior, G. A., da Silva, C. J., Eberhard, A., Ebert, A., de Figueiredo, D. M., Friedlander, M., Garcia, L. C., Girard, P., Hamilton, S., Ikeda-Castrillon S., Libonati R., Lourival R., de Azevedo Macedo H., Junior J., Mateus L., Morato R., Mourão G., Muniz C., Nunes A., de Oliveira M., da Rosa Oliveira M., Junior E., Padovani C., Penha J., Ribeiro D., de Oliveira Roque F., Silva A., Soriano B., Sousa Junior W., Tomas W., Tortao F., Urbanetz C. (2024). The end of an entire biome? World’s largest wetland, the Pantanal, is menaced by the Hidrovia project which is uncertain to sustainably support large-scale navigation. Science of the Total Environment, 908. https://doi.org/10.1016/j.scitotenv.2023.167751
Publisher’s Note
The statements, opinions, and data contained in all publications are solely those of the individual author(s) and contributor(s) and not of Recent Advances S.L. and/or the editor(s). Recent Advances S. L. and/or the editor(s) disclaim responsibility for any injury to people or property resulting from any ideas, methods, instructions, or products referred to in the content.
Appendix
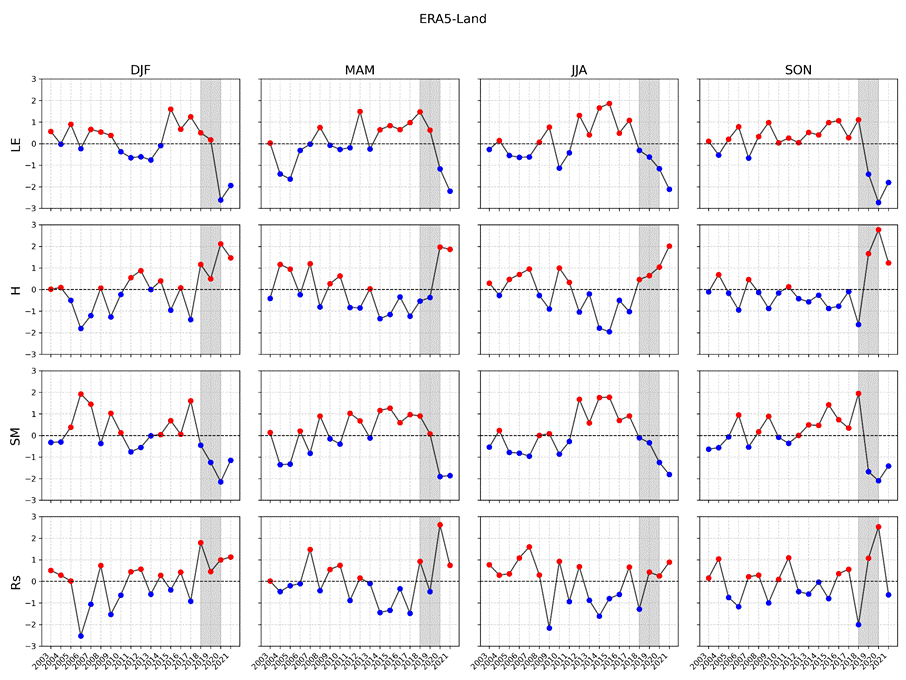
Figure A1: Seasonal standardized anomalies of latent (LE), sensible (H), soil-moisture (SM) and solar radiation (Rs) from ERA5land for the period 2003–2021. The panels display the variables across the four seasons, i.e. DJF (December–January-February), MAM (March–April-May), JJA (June–July-August), and SON (September–October-November). Red dots represent positive anomalies, blue dots indicate negative anomalies, and shaded gray areas highlight the notable drought period.
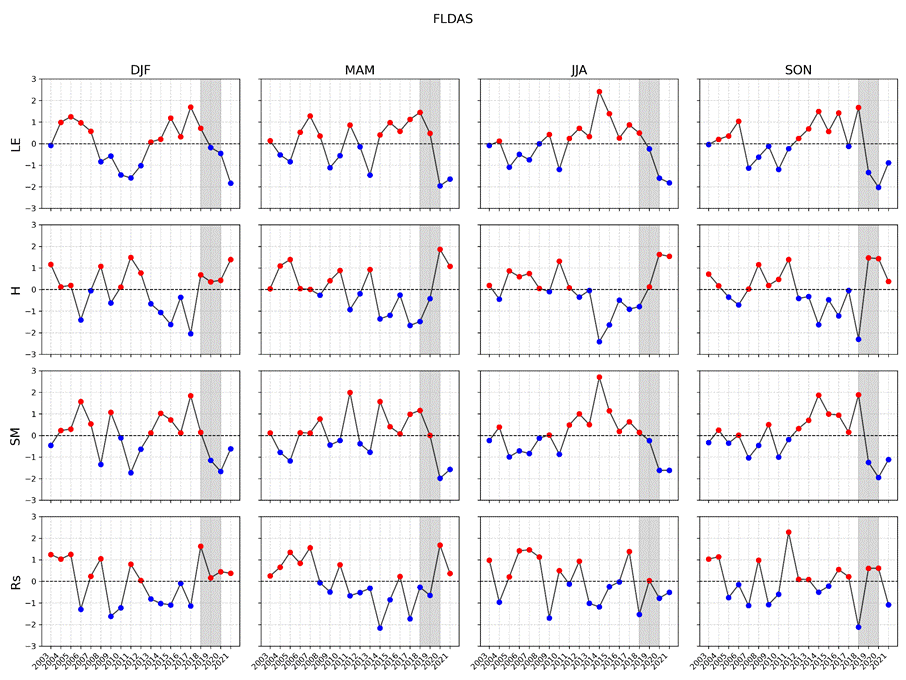
Figure A2: As Fig. A1 instead FLDAS reanalysis.
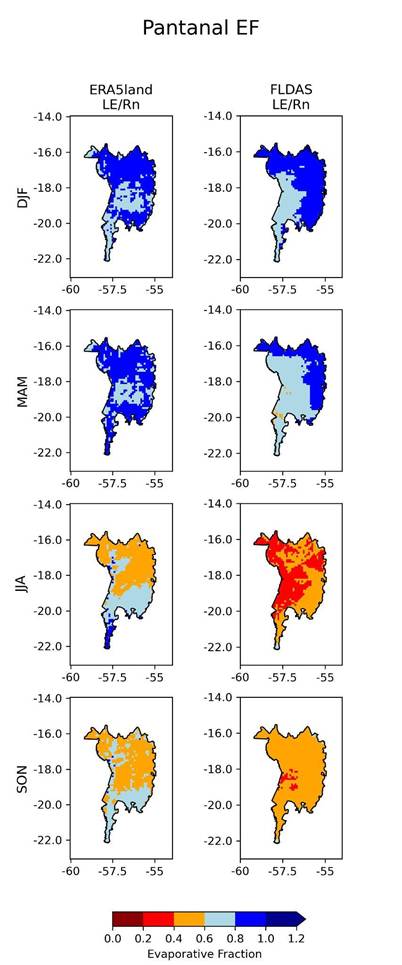
Figure A3: Climatological evaporative fraction for the four seasons, i.e. DJF (December–January-February), MAM (March–April-May), JJA (June–July-August), and SON (September–October-November), according to ERA5-Land and FLDAS (first and second columns, respectively).